Fig. 6.
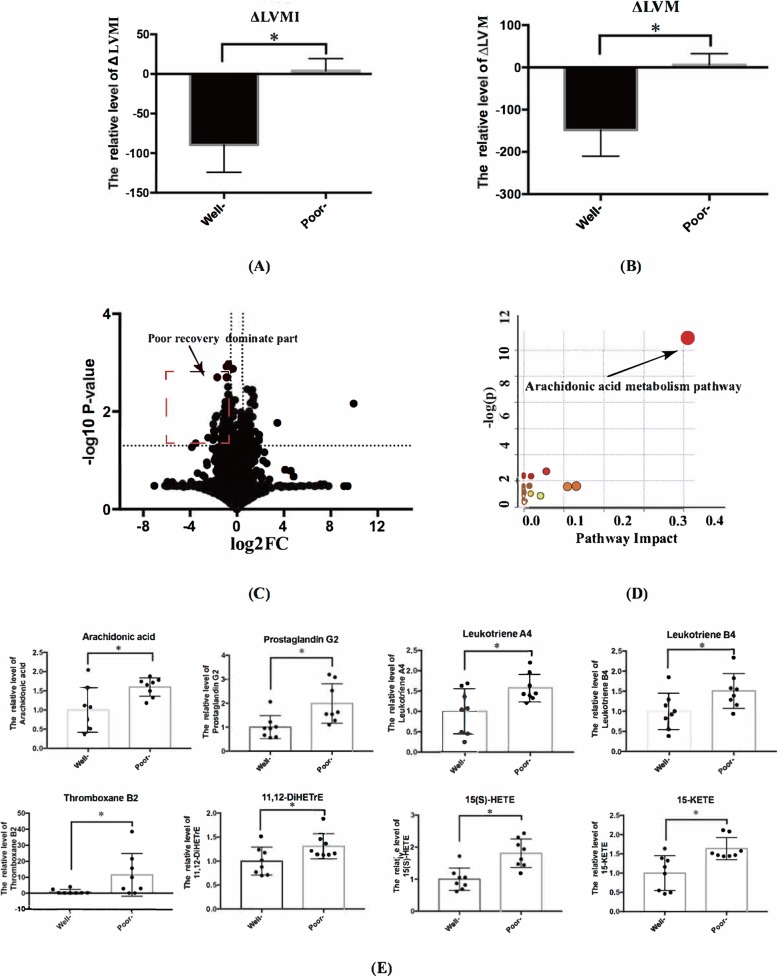
Post-procedural subgroup analysis for BAV patients. a One-year ∆LVMI and (b) ∆LVM in the 1st and 4th quartile groups (all P-value< 0.05). c Volcano plot showed the differentially expressed metabolites in the two groups. d The pathway enrichment analysis demonstrated elevated arachidonic acid metabolism pathway in patients within the 1st quartile of ∆LVMI (P-value< 0.05). e The different expression of metabolites in arachidonic acid metabolism pathway between patients within the 1st and 4th quartile of one-year ∆LVMI (* indicated P-value< 0.05)

