. 2019 Dec 20;42(3):295–308. doi: 10.1590/1516-4446-2018-0400

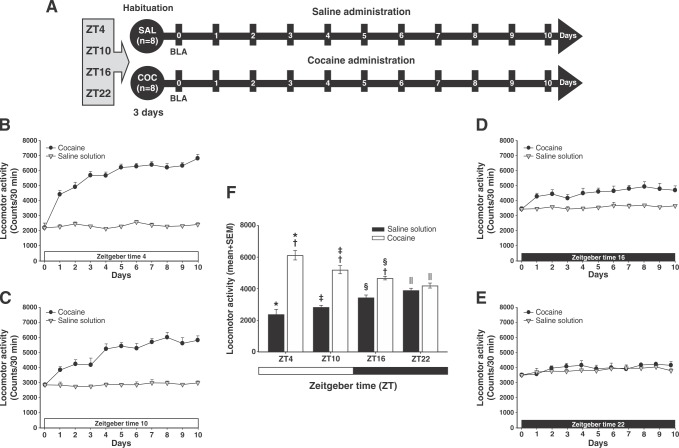
Figure 1. Diurnal variation in cocaine-induced locomotor activity. A) Experiment timeline. B-E) Cocaine-induced locomotor activity at Zeitgeber time (ZT)4, ZT10, ZT16, and ZT22. F) Mean (10 days) locomotor activity (± standard error of the mean [SEM]) by group (n=8 animals per group) at different times of day. White bars correspond to the administration of saline (SAL), and black bars, to the administration of cocaine (COC). The zero time point corresponds to basal locomotor activity (BLA). * Significant (p < 0.01) effects of COC on locomotor activity compared to the SAL group. Significant (p < 0.01) effects of COC or SAL on locomotor activity at ZT4 compared to the COC group at ZT10. Significant (p < 0.01) effects of COC or SAL on locomotor activity at ZT16 compared to the COC group at ZT22. § Significant (p < 0.01) effects of COC or SAL on locomotor activity at ZT10 compared to the COC group at ZT16. || Significant (p < 0.01) effects of COC or SAL on locomotor activity at ZT22 compared to ZT4, determined by a two-way analysis of variance (ANOVA) followed by Tukey’s tests.

Figure 1