
Figure 4.
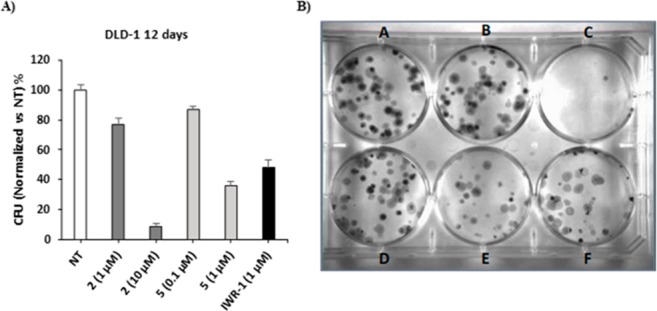
(A) Bar diagram of antiproliferative effects on DLD-1 CRC cells of 2 and 5. (B) Colony forming assay on DLD-1 cancer cells. (A) untreated cells; (B) compound 2 at 1 μM; (C) compound 2 at 10 μM; (D) compound 5 at 0.1 μM; (E) compound 5 at 1 μM; (F) IWR-1 at 1 μM.