Figure 1.
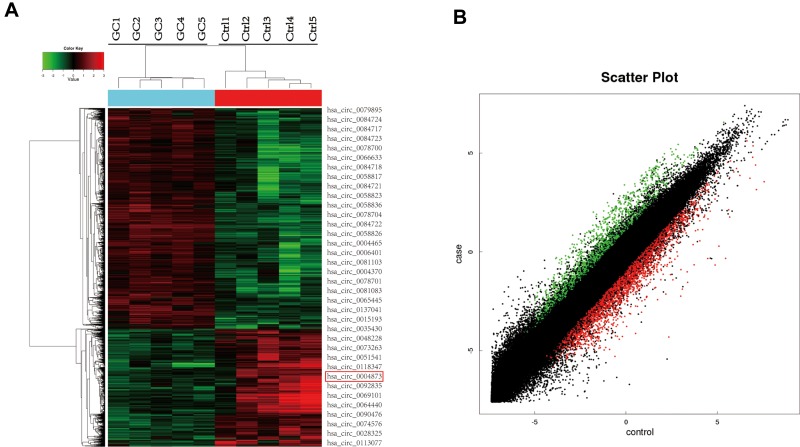
CircRNA microarray chip expression profiles in gastric cancer. (A) The top 24 upregulated (green) and 12 downregulated (red) circRNAs shown by heat map. Rows represent circRNAs, while columns represent specimens (GC-GC5, Ctrl1-Ctrl5). The red rectangle indicates hsa_circ_0004873 (circ-OXCT1). (B) Scatter plot demonstrating the differentially expressed circRNAs in the microarray analysis. Green dots represent the upregulated circRNAs, while red dots represent the downregulated circRNAs (FC >2 and p < 0.05).
Abbreviations: GC, gastric cancer; Ctrl, paracancerous specimens; FC, fold change.

