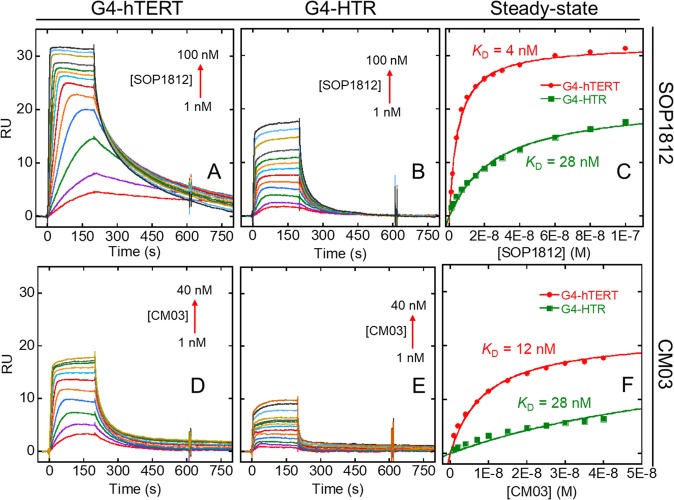
Figure 2.
Representative sensorgrams and steady state equilibrium binding of (A–C) SOP1812 and (D–F) CM03 to G4-hTERT and G4-HTR. The concentrations of each compound are shown, and the arrows show the direction of increased response in the sensorgrams with increased concentration. The steady state shows the binding plot at equilibrium. The steady-state response unit (RU) at lower concentration in A was predicted by kinetic estimation. Binding constants were obtained for a single-site binding model (Table 2).

