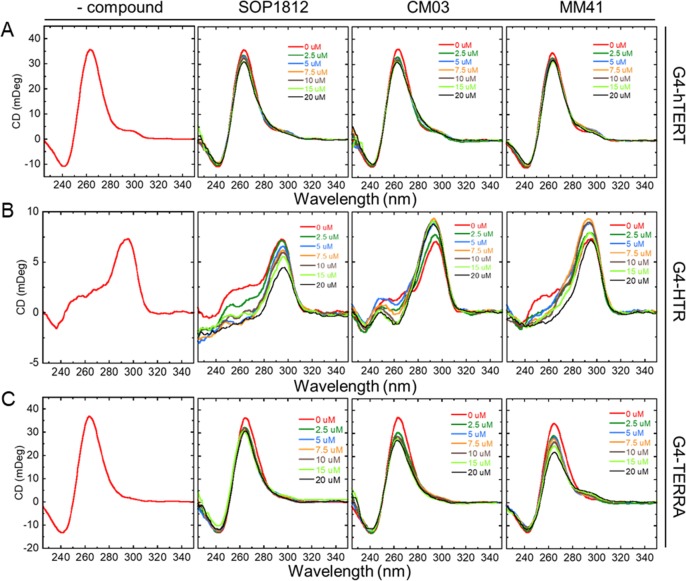
Figure 6.
CD spectra of compounds titrated with G4s. (Row A) G4-hTERT. (Row B) G4-HTR. (Row C) G4-TERRA. CD spectra of native G4s are in the far-left column. Titrations with each compound are indicated. Each G4 concentration was constant at 5 μM with increasing compound concentrations up to 20 μM. Duplicate readings were averaged.

