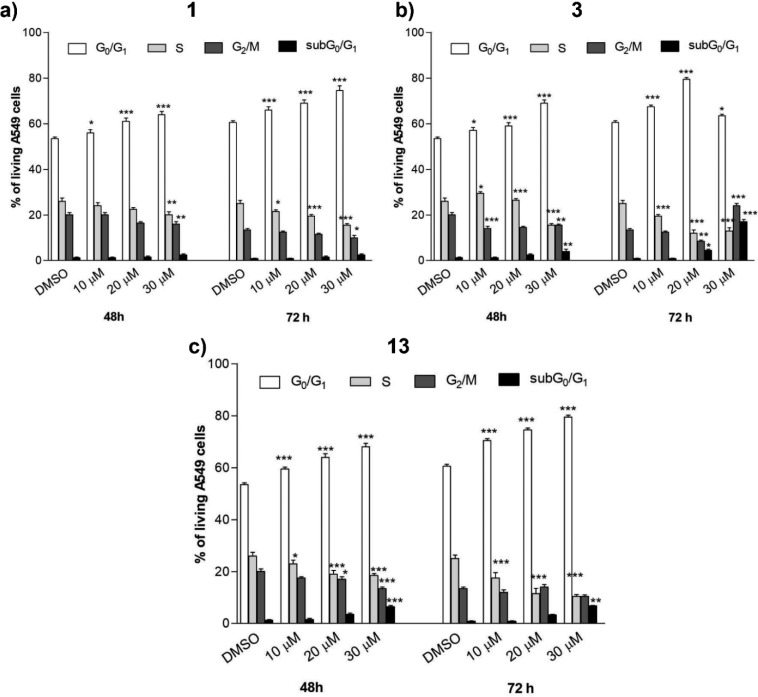
Figure 6.
A549 cancer cells were treated with compounds 1 (a), 3 (b), and 13 (c) at different concentrations for 48 or 72 h. The percentage of cell cycle stages was analyzed after DNA propidium iodide staining by flow cytometry. Results are expressed as means ± SEM of two independent experiments performed in triplicate (*P < 0.05, **P < 0.005,***P < 0.001).

