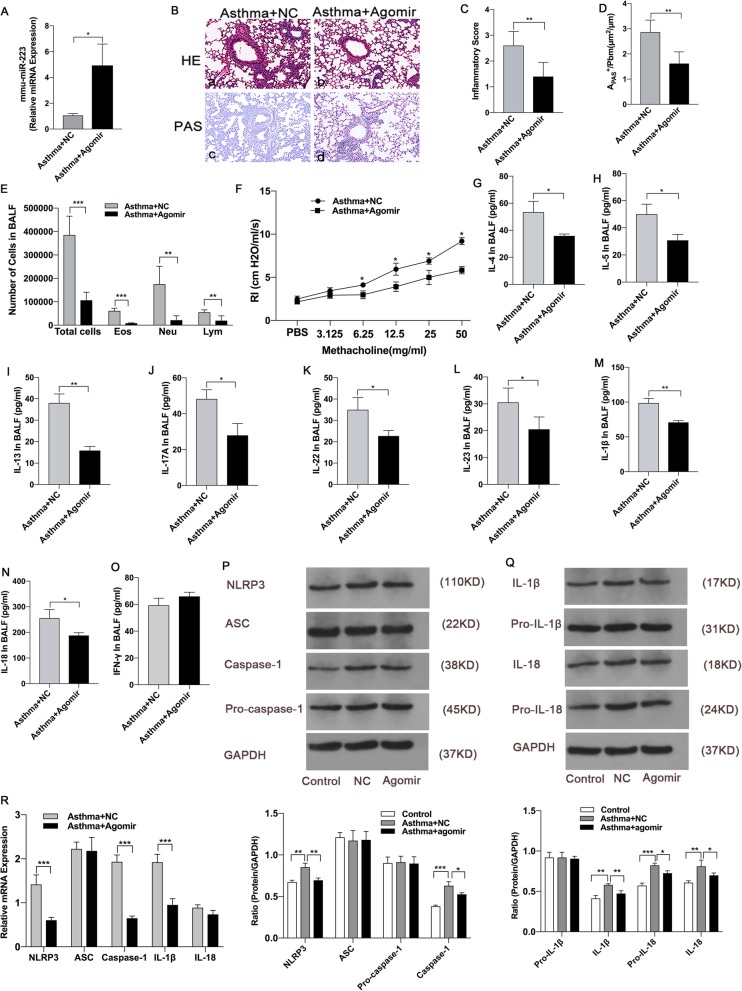
Fig. 5.
MiR-223 agomirs attenuated airway inflammation in neutrophilic asthma. OVA/CFA was administrated to WT mice on day 0. Mice were treated with 5 nmol miR-223 agomirs or negative control agomirs on days 21–23 before each challenge, respectively. a The expression of miR-223 was detected in lung tissues by qPCR. n = 6–8 mice/group; statistical significance was determined by unpaired Student’s t test. b Representative micrographs of lung H&E staining a-b and PAS staining c-d from treated mice (200× magnification). c-d Semi-quantification of lung inflammatory score and Apas+/Pbm was performed. n = 6–8 mice/group; statistical significance was determined by unpaired Student’s t test. e Number of total inflammatory cells, neutrophils, eosinophils, and lymphocytes was calculated in BALF after treatment. n = 6–8 mice/group; statistical significance was determined by unpaired Student’s t test. f AHR was determined by lung resistance after treatment. n = 6–8 mice/group. Statistical significance was determined by unpaired Student’s t test. g-o The levels of Th2-associated cytokines (IL-4, IL-5, IL-13), Th17-associated cytokines (IL-17A, IL-22, IL-23), Th1-associated cytokine (IFN-γ), IL-1β, and IL-18 in BALF were measured by ELISA after treatment. n = 6–8 mice/group; statistical significance was determined by unpaired Student’s t test. p Proteins expression of NLRP3, ASC, caspase-1, pro-caspase-1 and GAPDH were measured by western blot after treatment. Representative immunoblot from three independent mice. q Proteins expression of IL-1β, pro-IL-1β, IL-18, pro-IL-18, and GAPDH were measured using western blotting after treatment. Representative immunoblot from three independent mice. n = 6–8 mice/group; statistical significance was determined using ANOVA. r Genes expression of NLRP3, ASC, caspase-1, IL-1β and IL-18 were determined by qPCR after treatment. n = 6–8 mice/group; statistical significance was determined by unpaired Student’s t test. All data were expressed as mean ± SD. *P < 0.05, **P < 0.01

