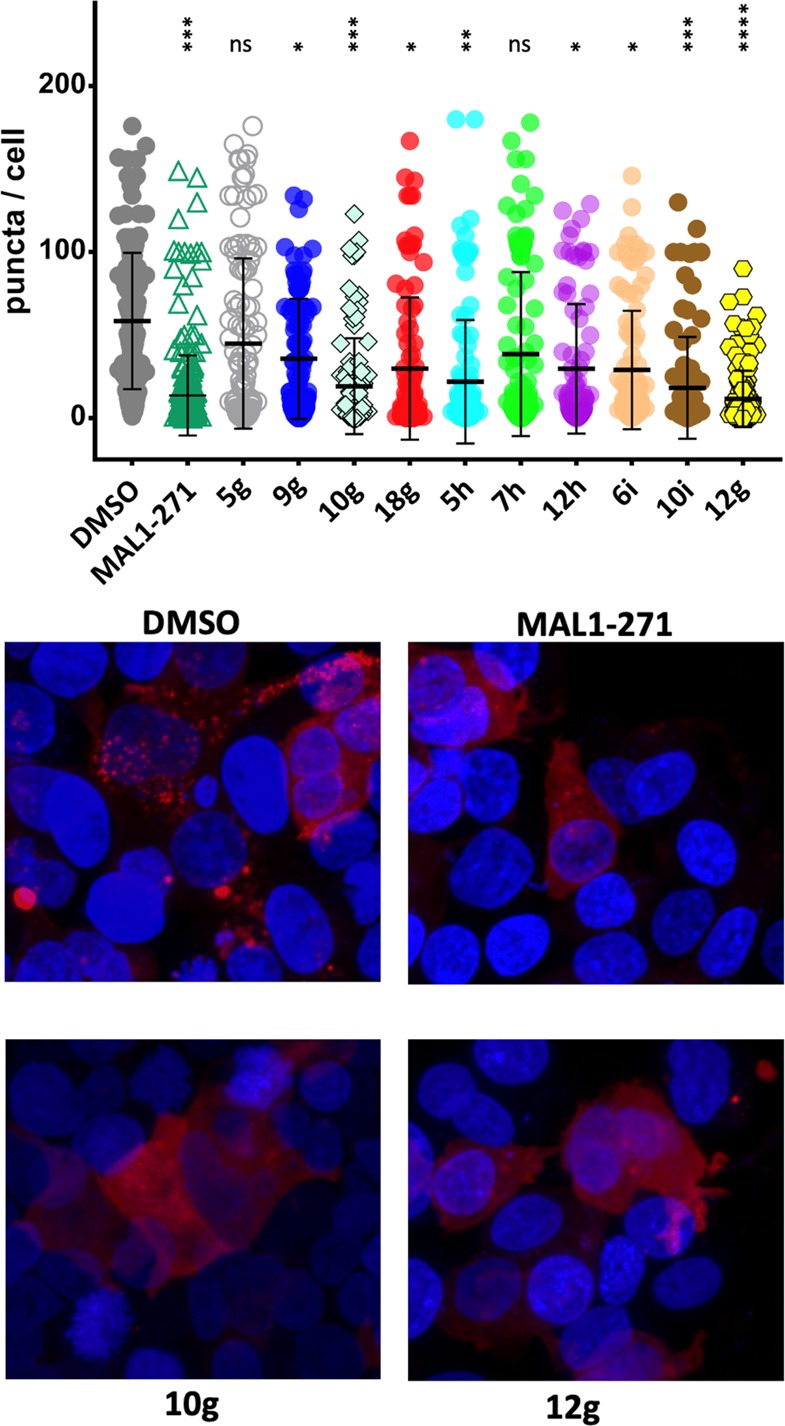
Figure 2.

HEK293H cells were transfected with 4 μg of an HTT17Q-mCherry construct,41 and 24 h after transfection cells were treated with 10 μM compound or DMSO for 6 h. Top panel: number of puncta per cell. Statistically significant differences between control and treated samples are indicated by asterisks. * p < 0.05; ** p < 0.005; *** p < 0.0005; **** p < 0.00005 compared to the DMSO control. Bottom panel: representative cell images for negative control (DMSO), positive control (MAL1-271), and analogs 10g and 12g. Toxic aggregates are shown as red dots. See SI for additional information.
