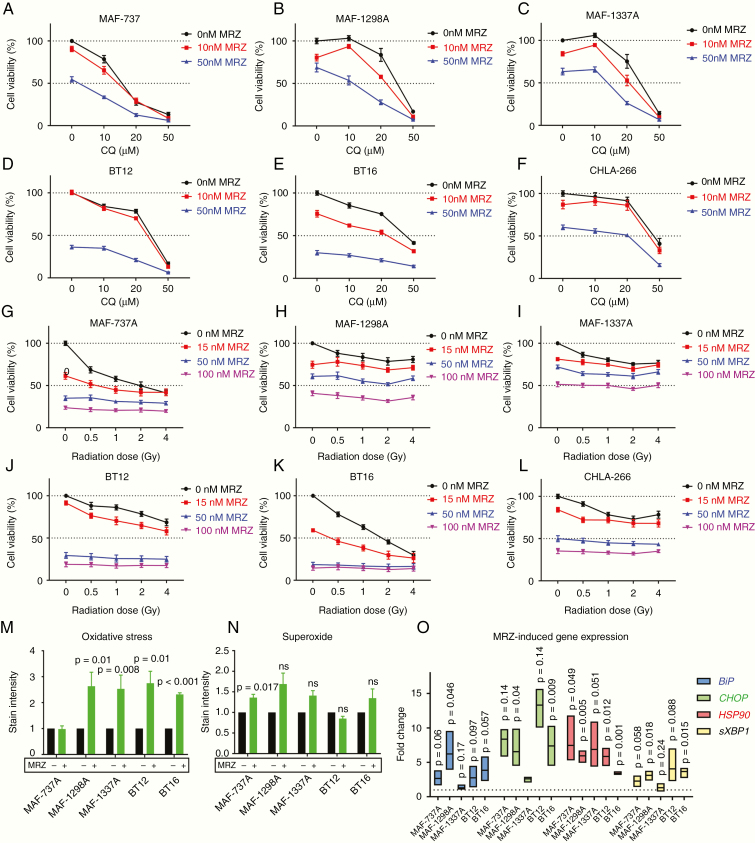
Figure 4.
Proteasome inhibition is generally not synergistic with either autophagy inhibition or radiation therapy, but induces oxidative stress. (A–F) End point measures of viability by CellTiter Glo, shown as % of Dimethyl sulfoxide (DMSO) control for MAF-737A (A), MAF-1298A (B), MAF-1337A (C), BT12 (D), BT16 (E), and CHLA-266 (F) cell lines treated with varying concentrations of marizomib (MRZ) and chloroquine (CQ). (G–L) End point measures of viability by CellTiter Glo, shown as % of DMSO control for MAF-737A (G), MAF-1298A (H), MAF-1337A (I), BT12 (J), BT16 (K), and CHLA-266 (L) cell lines treated with varying concentrations of MRZ and Cs-137 radiation. Statistics shown for (A–L) are for 2-way ANOVA. (M–N) Cells treated for 24 h with 100 nM MRZ and stained for ROS (M) and superoxide (N) and quantified by flow cytometry. Statistics shown are Dunnett’s multiple comparisons test of MRZ-treated versus DMSO control for normalized data. (O) Real-time quantitative PCR for HSPA5 (BiP), CHOP, HSP90, and spliced XBP1 (sXBP1) after 24-h treatment with 100 nM MRZ. Statistics shown are 1-tailed Student’s T-test compared with DMSO-treated controls, n = 3.

