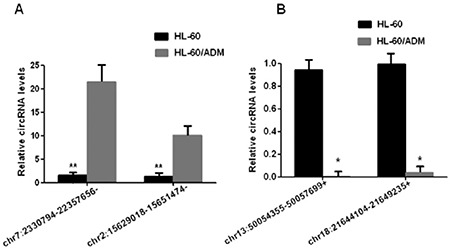
Figure 5.

Expression levels of differentially expressed circRNA were detected by RT-qPCR. The horizontal axis is genes and the vertical axis is circRNA expression levels. A) Two genes, chr7:2330794-22357656- and chr2:15629018-15651474, were selected from circRNA with upregulated expression. B) chr13:50054355-50057699+ and chr18:21644104-21649235+ were selected from downregulated circRNAs. The target RNA and internal parameters of each sample were subjected to real-time PCR, which was repeated three times. The data were analyzed by 2-ΔΔC T method. **p<0.01,*p<0.05.
