
Figure 1. Investigation of structural elements supporting G protein-biased signaling by the D2R.
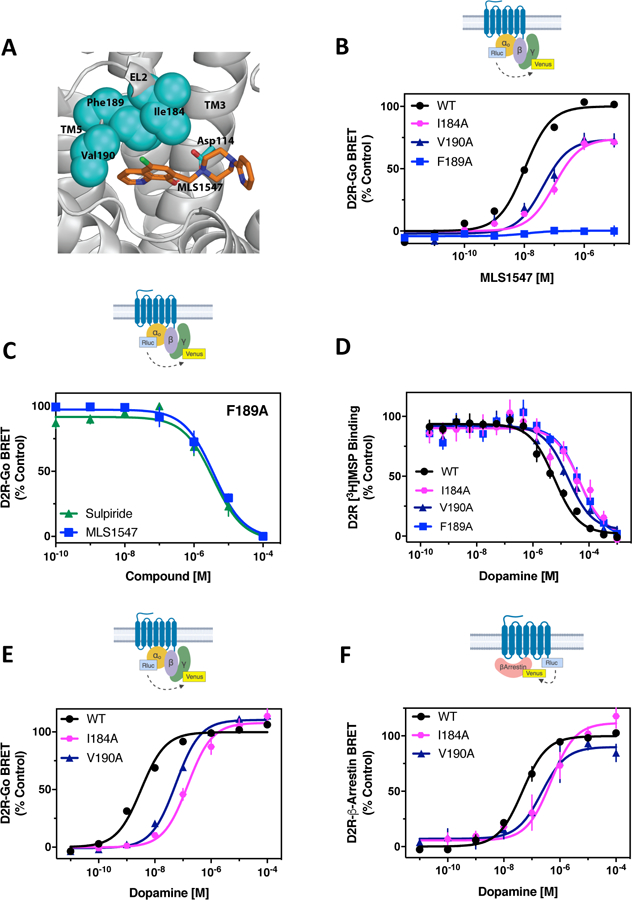
(A) Pharmacophore model for MLS1547 interactions with the D2R (modified from (27)). (B) The D2R-WT or the indicated D2R mutants were expressed in HEK293 cells with Goα1-Rluc8, β1, and γ2-mVenus. The cells were stimulated with MLS1547 and assayed for G protein activation by BRET. (C) HEK293 cells expressing D2R-F1895.38A, Goα1-Rluc8, β1, and γ2-mVenus were incubated with 13 µM (EC80) dopamine and the indicated concentrations of either sulpiride or MLS1547 and assayed for G protein activation by BRET. (D) Membrane preparations from HEK293 cells expressing either D2R-WT or D2R-I184EL2A, V1905.39A or F1895.38A were incubated with the indicated concentrations of dopamine and [3H]methylspiperone. Data are expressed as a percentage of the specific binding and fit using non-linear regression analyses (table S2). (E) HEK293 cells described in (B) were stimulated with dopamine and assayed for G protein activation. (F) The D2R-WT and indicated mutant receptors were fused to Rluc8 and expressed with β-arrestin2-mVenus and GRK2 in HEK293 cells. Dopamine-stimulated β-arrestin recruitment was assessed by BRET. Functional data are expressed as a percentage of the maximum dopamine or MLS1547 responses for D2R-WT (% control). Data in (B) to (F) represent the mean ± SEM values of 3–5 independent experiments performed in technical triplicate. Average EC50 and Emax values for functional assays are displayed in table S1.