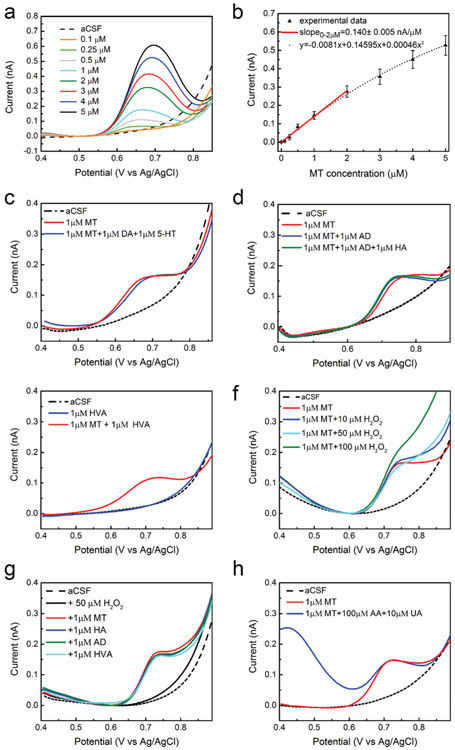
Fig. 1.
In vitro SWV MT detection at CFEs: (a) average (n = 5, SEM omitted for clarity) in vitro SWV MT calibrations conducted at CFEs in aCSF reveal clear MT peaks at 0.7 V. (b) In vitro SWV MT calibration curve conducted at CFEs. The average (n = 6) sensitivity (baseline subtracted peak current vs. MT concentration) is linear up to 2 μM (slope: 0.140 ± 0.005 nA μM−1, red line). For the concentrations above 2 μM, a non-linear trend is observed and agrees very well (r2 = 0.99) with a second-degree polynomial equation (y = −0.0081 + 0.14595x + 0.000459872x2, dot black line). (c) MT can be distinguished among DA and 5-HT. SWVs relative to 1 μM MT (red) and a contaminant mixture (1 μM MT plus 1 μM DA plus 1 μM 5-HT, blue) show that DA and 5-HT do not present oxidation peaks in the potential window used. (d) MT can be distinguished among AD and HA. SWVs relative to 1 μM MT (red) and a 1 μM MT plus 1 μM AD (blue) and a contaminant mixture (1 μM MT plus 1 μM AD plus 1 μM 5-HT, green) show that AD and HA do not present oxidation peaks in the potential window used. (e) MT can be detected in presence of HVA. SWVs relative to 1 μM HVA do not show peaks in the potential range used at neutral pH. (f) MT can be detected in presence of H2O2 in the concentration range of 10–50 μM. (g) MT can also be distinguished among AD, HA, HVA, in presence of H2O2. SWVs do not shown peaks in the potential range used and SWV corresponding to 1 μM MT collected in mixtures of these molecules does not differ from the one collected in aCSF. (h) MT can be distinguished among AA and UA. SWV corresponding to 1 μM MT collected in a mixture of 100 μM AA and 10 μM UA (blue) in aCSF shows that MT can be detected in presence of high concentration of AA and UA. In red, the SWV corresponding to 1 μM MT collected in aCSF is reported for comparison.

