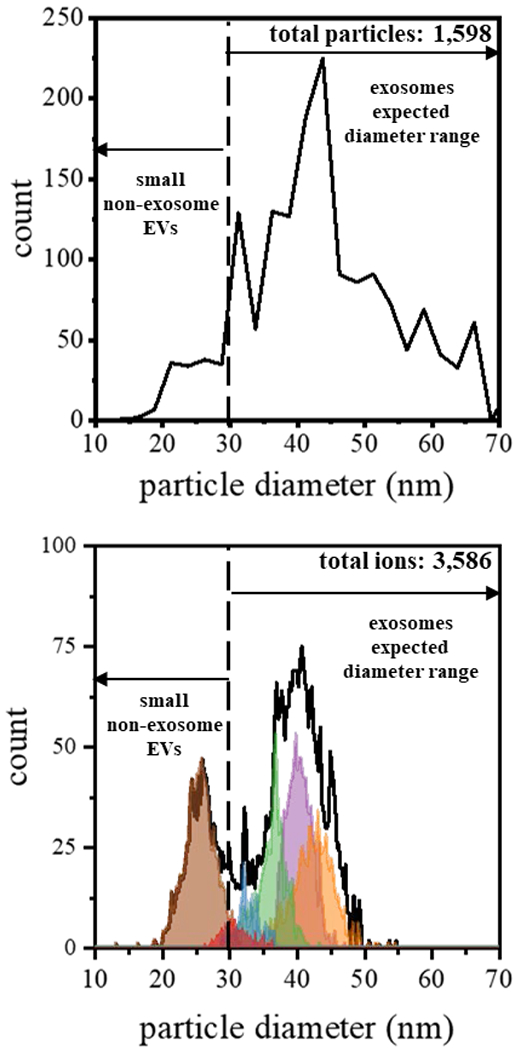
Figure 4.

Comparison of diameters derived from CDMS measurements and EM images. (top) Plot showing the frequency distribution of electron micrograph-derived diameters (shown in Figure 2) using a bin size of 2.5 nm. (bottom) Plot of CDMS-derived diameters for each of the subpopulation (shown in Figure 3) using a bin size of 0.5 nm. Particle diameters from CDMS were determined by assuming a spherical geometry and a density of 1.15 g·cm−3.
