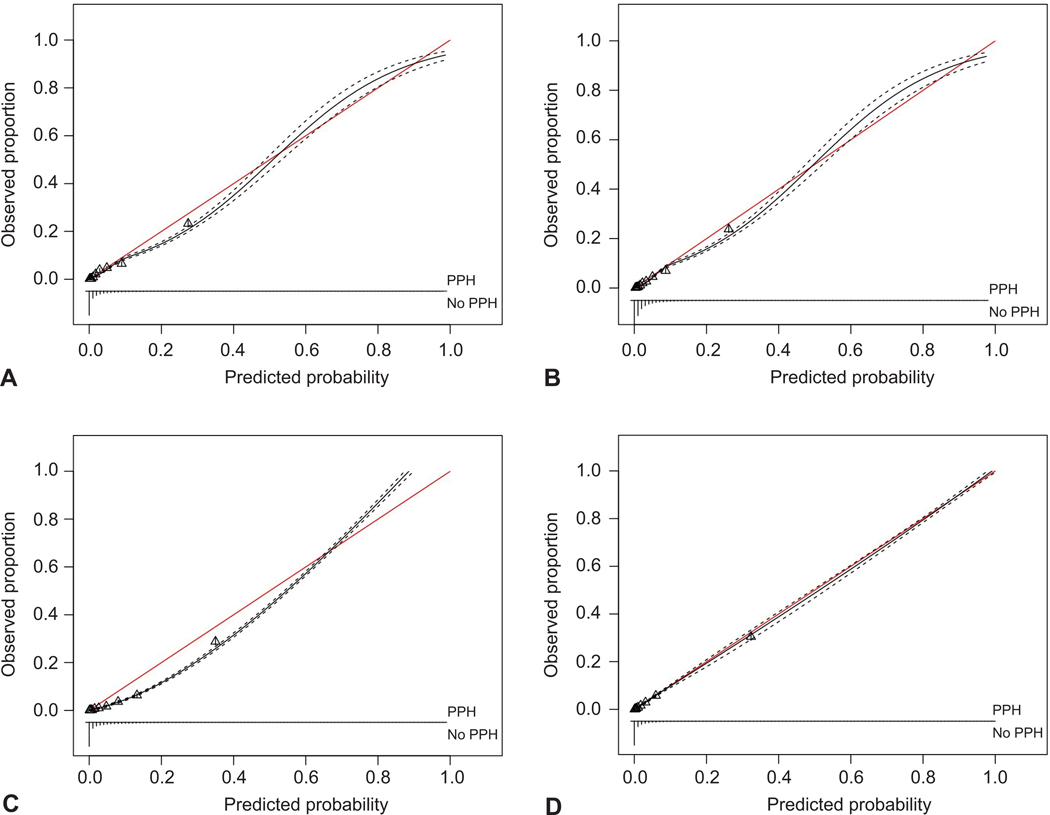
Figure 2.
Calibration curves demonstrating the performance of predicting postpartum hemorrhage (PPH) for all four models: Logistic regression (A), logistic regression with lasso regularization (B), random forest (C), and extreme gradient boosting (D). The figure demonstrates the variation in each model’s performance. The red line indicates perfect agreement between the predicted probability of the model and the actual probability. The black line bounded by two dotted lines indicates the overall calibration with 95% CIs of each model. Each triangle represents a group of individuals risk. There are 10 triangles and each triangle represents a decile of risk. A. Calibration (intercept: –0.17 [–0.22 to –0.11]; slope: 0.96 [0.92 to 1.00]); discrimination (C-statistic: 0.87 [0.86 to 0.87]). B. Calibration (intercept: –0.20 [–0.26 to –0.15]; slope: 1.08 [1.04 to 1.12]); discrimination (C-statistic: 0.87 [0.86 to 0.88]). C. Calibration (intercept: –0.60 [–0.66 to –0.54]; slope: 1.28 [1.23 to 1.33]); discrimination (C-statistic: 0.92 [0.91 to 0.92]). D. Calibration (intercept: –0.13 [–0.19 to –0.06]; slope: 1.02 [0.98 to 1.06]); discrimination (C-statistic: 0.93 [0.92 to 0.94]).

