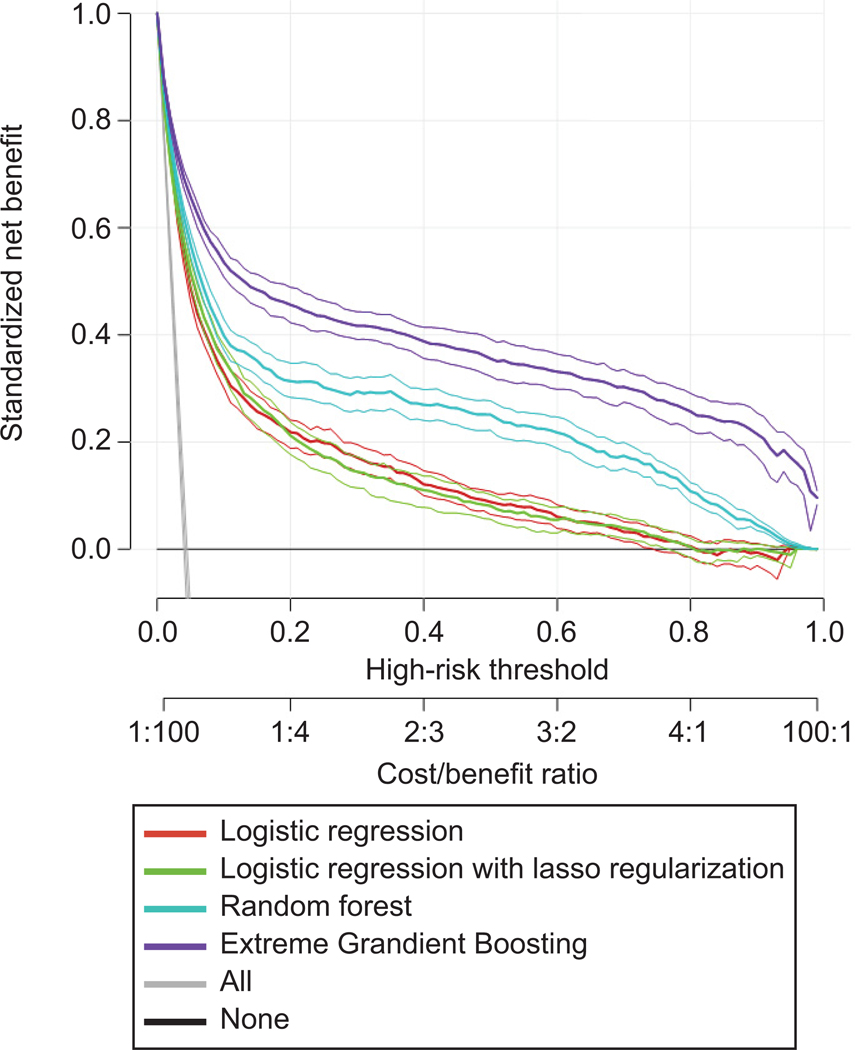
Figure 3.
Decision curve analysis of predicting postpartum hemorrhage by all models. The x-axis indicates the threshold probability for postpartum hemorrhage outcome. The threshold probability is a level of certainty above which the patient or physician would choose to intervene. The probability threshold captures the relative value the patient or physician places on receiving an intervention for the outcome, if present, to the value of avoiding an intervention if the outcome is not present. The y-axis indicates the net benefit. The net benefit is calculated as true positive rate – (false positive rate x weighting factor). Weighting factor is calculated as threshold probability/1–threshold probability. For example, when threshold probability is 0.1, weighting factor is 0.1/1–0.1=0.1/0.9. The decision curves indicate the net benefit of each model as well as two clinical alternatives (classifying no women as having the outcome vs. classifying all women as having the outcome) over a specified range of threshold probabilities of outcome. Compared with the clinical alternatives, the net benefit for the Extreme Gradient Boosting model was greatest across the range of threshold probabilities.

