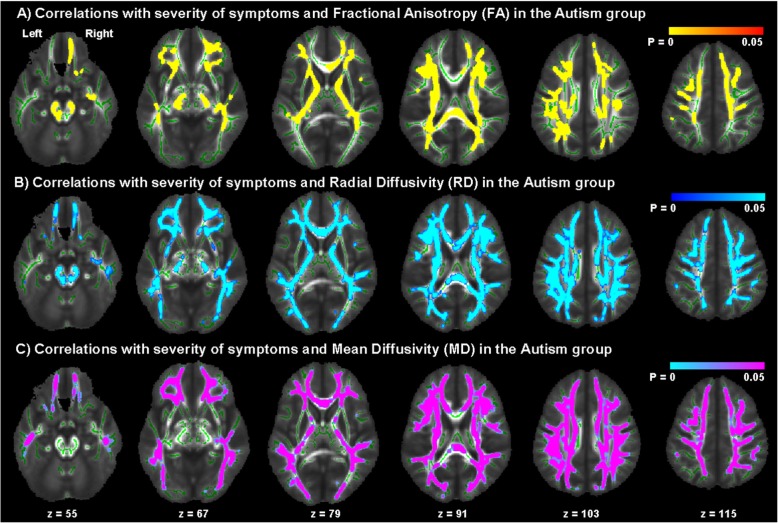
Fig. 2.
Correlations with ADOS-D symptom measures. Clusters of significant correlation between the ADOS-D measures in the ASC group and a FA, b RD and c MD. Correlations were negative for FA and positive for RD and MD. Statistically significant voxels are displayed in red, blue and purple; white matter skeleton voxels are displayed in green. Significance was set at p < 0.05 and was corrected for multiple comparisons with family wise error. Group differences ‘thickened’ and images flipped in the right-left plane for visualization purposes

