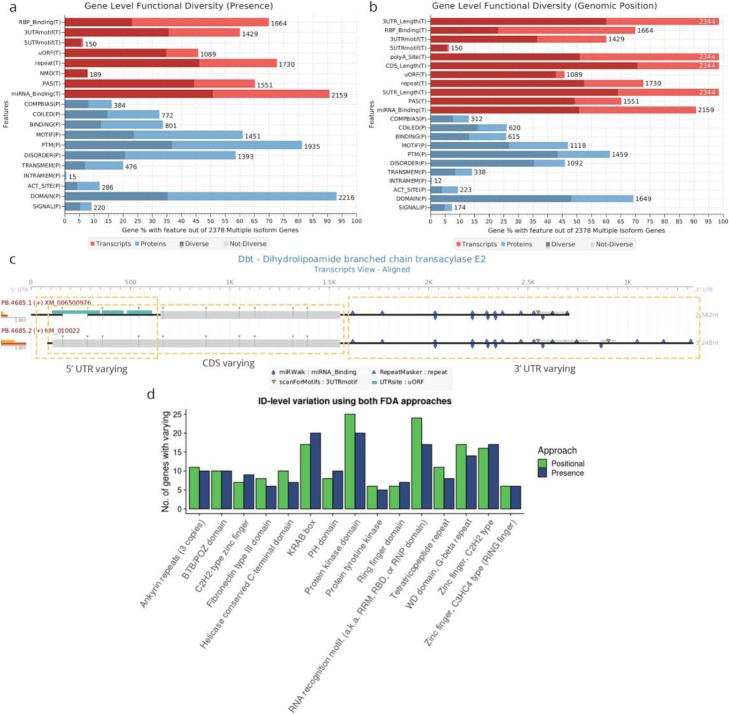
Fig. 3.
Functional diversity analysis (FDA) results. Annotation type summary of FDA results for the murine neural dataset with the presence/absence (a) and positional (b) approaches. The percentage of multi-isoform genes annotated with the feature type is shown by total bar length, where the light and dark areas indicate respectively the percentage of genes where none or at least one isoform is varying for that feature type. The numbers above the bars indicate the total no. of feature-containing genes for that category. Both transcript (red) and protein/coding (blue) feature categories are shown. c tappAS graphical representation of the transcript-level annotation for the Dbt gene, where 5′ UTR, CDS, and 3′/alternative polyadenylation variation were detected. Dotted lines indicate the varying regions. d Comparison of position vs the presence/absence approach FDA results for the ID-level analysis of variation in PFAM domains. Top 15 domain families ranked by the total number of varying genes are shown

