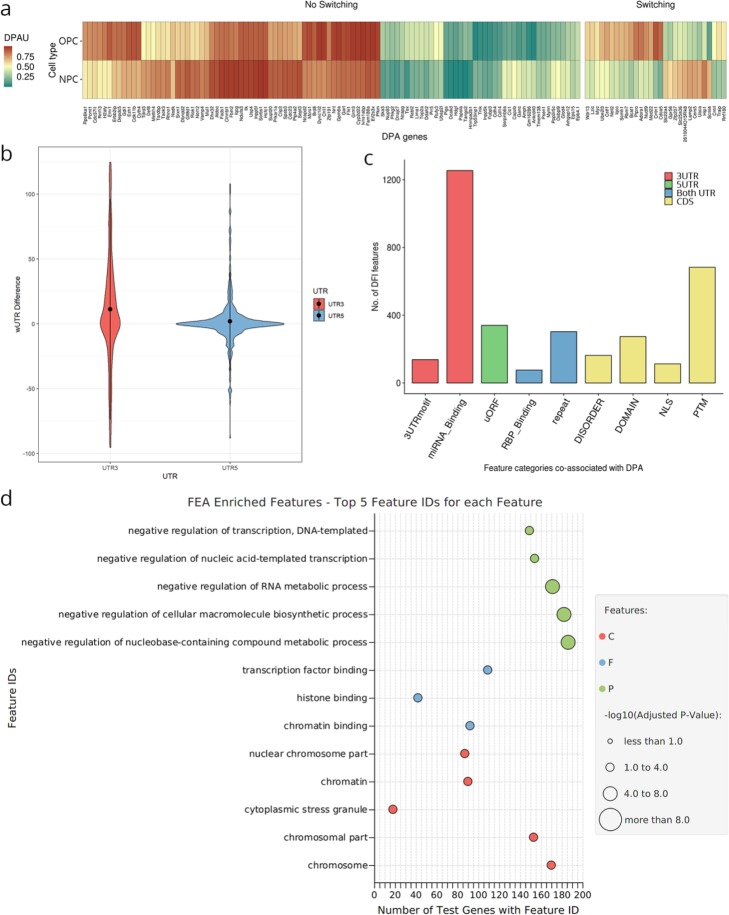
Fig. 6.
Differential polyadenylation analysis (DPA) results. a Heatmap displaying distal polyA usage (DPAU) levels of genes that are most significantly DPA (FDR < 0.001, threshold stringency increased for visualization purposes) for each cell type. b Violin plots showing the distribution of the difference in expression-weighted 3′ and 5′ UTR lengths (UTRw) between OPCs and NPCs. c Frequency of differential inclusion of features from several annotation categories for DPA (FDR > 0.05) genes. Bar color indicates the transcript region where the feature is present. d Functional enrichment of DPA genes for GO terms (Fisher’s exact test, multiple testing correction by Benjamini-Hochberg method, FDR < 0.05). Dot color indicates the GO term aspect, while dot size indicates significance level

