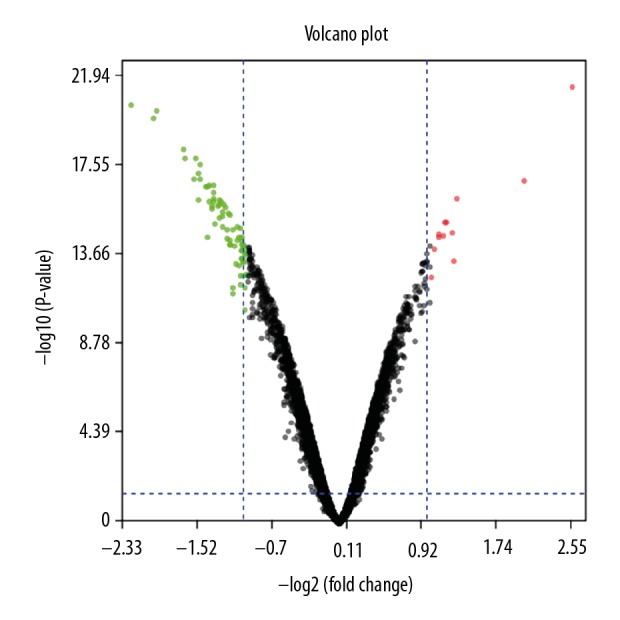
Figure 8.

Identification of the DEGs between FGFR2-silenced BC cells and control. The volcano plot indicated the distributions of DEGs in GSE74146. The green and red dots represented the downregulated and upregulated DEGs, respectively. DEGs – differentially expressed genes; FGFR2 – fibroblast growth factor receptors 2; BC – breast cancer.
