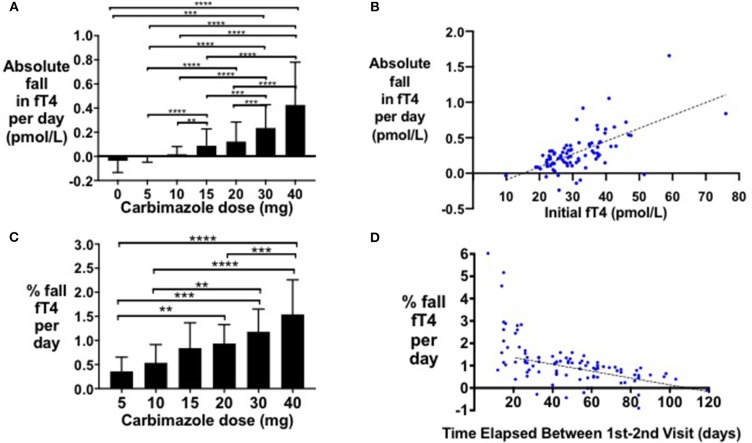
Figure 2.
(A) Bar graph of absolute fall in fT4 per day by carbimazole dose across all study visits (**P < 0.01, ***P < 0.001, ****P < 0.0001). (B) Scattergraph of absolute fall in fT4 per day (pmol/L) in patients receiving 20 mg carbimazole daily following initial visit (absolute fall in fT4 per day = 0.018*initial fT4 −0.27, r2 = 0.40, P < 0.0001). (C) Scattergraph of percentage fall in fT4 per day (%) between the first and second visits in patients receiving 20 mg carbimazole daily following their initial assessment (% fall in fT4 per day = −0.015 * number of days between visits + 1.693, r2 = 0.30, P < 0.0001). (D) Scattergraph of percentage fall in fT4 per day (%) in patients taking 20 mg carbimazole by time elapsed (days) between the first and second visits.

