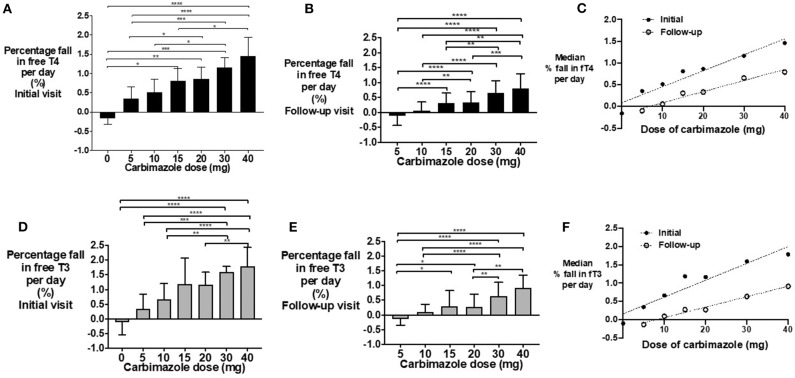
Figure 3.
(A) Bar graph of percentage fall in fT4 per day in patients on carbimazole following their initial visit with groups compared using Kruskal-Wallis test with post-hoc Dunn's test (*P < 0.05, **P < 0.01, ***P < 0.001, ****P < 0.0001). (B) Bar graph of percentage fall in fT4 per day in patients on carbimazole following their follow-up visit with groups compared using Kruskal-Wallis test with post-hoc Dunn's test (*P < 0.05, **P < 0.01, ***P < 0.001, ****P < 0.0001). (C) Scattergraph of median percentage fall in fT4 per day in patients receiving carbimazole at both initial and follow-up visits.
Initial median % fall in fT4 per day = 0.04* carbimazole dose + 0.09, r2 = 0.93, P = 0.0004. Follow-up median% fall in fT4 per day = 0.03*carbimazole dose −0.17, r2 = 0.97, P = 0.0005. (D) Bar graph of percentage fall in fT3 per day in patients on carbimazole following their initial visit with groups compared using Kruskal-Wallis test with post-hoc Dunn's test (*P < 0.05, **P < 0.01, ***P < 0.001, ****P < 0.000). (E) Bar graph of percentage fall in fT3 per day in patients on carbimazole following their follow-up visit with groups compared using Kruskal-Wallis test with post-hoc Dunn's test (*P < 0.05, **P < 0.01, ***P < 0.001, ****P < 0.0001). (F) Scattergraph of median percentage fall in fT3 per day in patients receiving carbimazole at both initial and follow-up visits.
Initial median% fall in fT3 per day = 0.05* carbimazole dose + 0.16, r2 = 0.91, P = 0.0008. Follow-up median% fall in fT3 per day = 0.03* carbimazole dose −0.23, r2 = 0.98, P = 0.0002.

