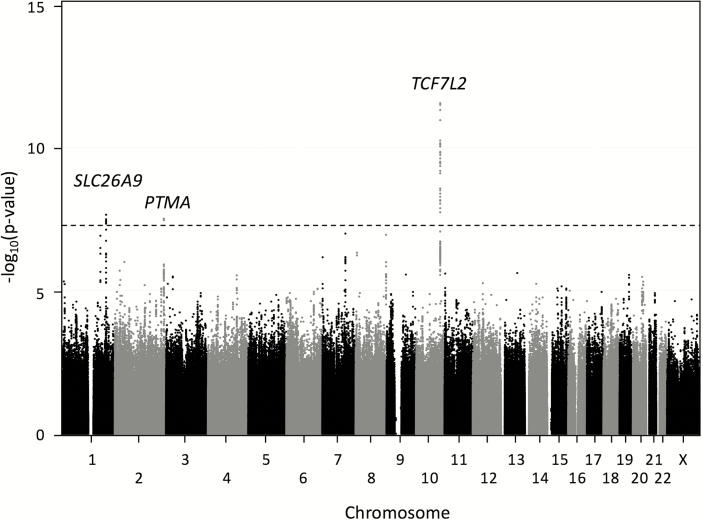
Figure 1.
Manhattan plot of phase 1 + 2 combined association analysis. Association analysis was performed on all variants with minor allele frequency (MAF) > 2% that passed quality control criteria. The x-axis indicates chromosomal position, and the y-axis indicates the strength of evidence for association with cystic fibrosis–related diabetes (-log10[P value]) by Cox proportional hazards regression including frailty model to allow for clustering by family. The black line corresponds to the genome-wide significance threshold (P value = 5e-8).

