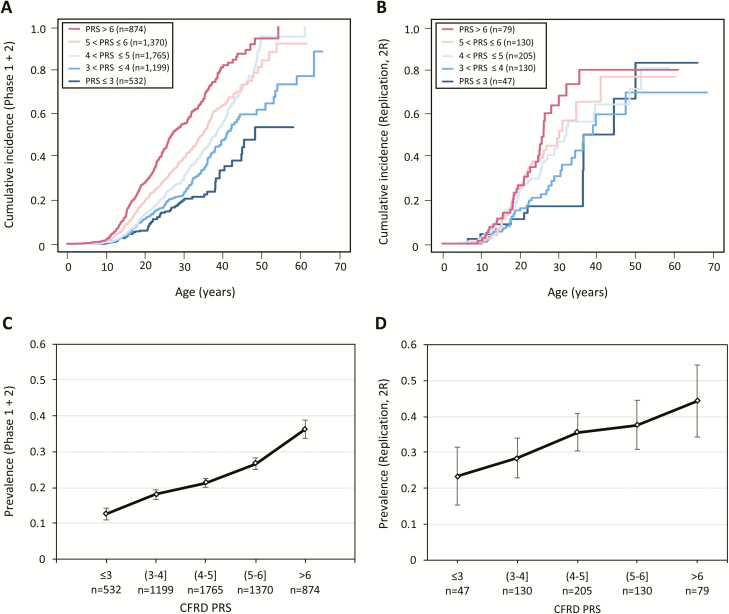
Figure 4.
Cumulative incidence and prevalence plots by CFRD PRS in test and replication populations. Cumulative incidence plots of incidence of CFRD in (A) phase 1 + 2 populations and (B) replication population. Individuals are divided into bins based on their CFRD PRS. Prevalence plots of CFRD in (C) phase 1 + 2 populations and (D) replication population, divided by CFRD PRS bin. Abbreviations: CFRD, cystic fibrosis–related diabetes; PRS, polygenic risk score.

