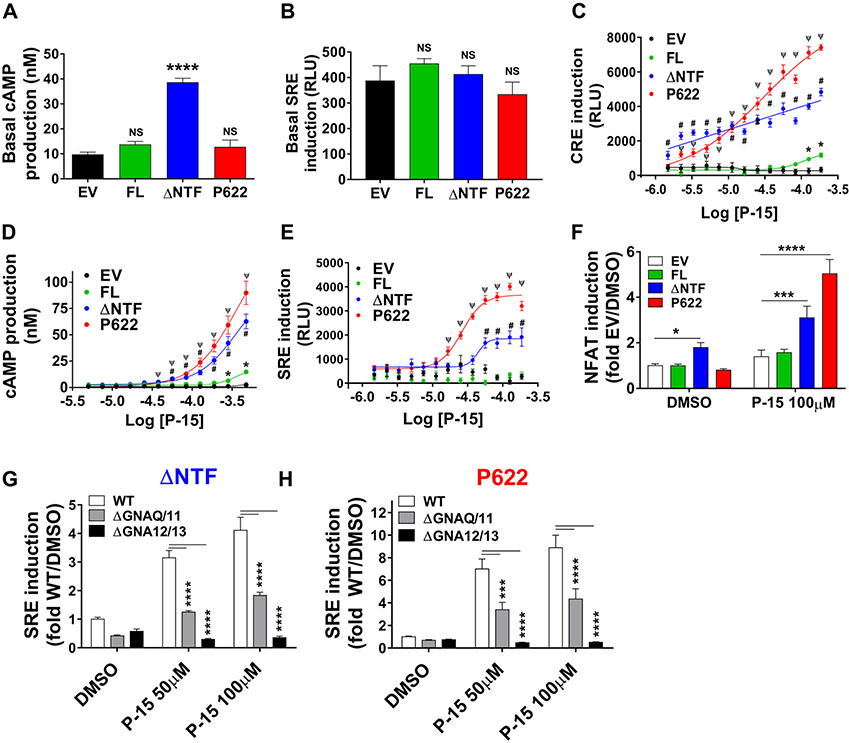
Figure 2.
Multiple signaling pathways are activated by endogenous tethered agonist and synthetic agonistic peptide. (A) HEK cells were transiently transfected with EV, FL, ΔNTF, or P622 plasmids and were serum starved overnight in the presence of IBMX (0.5 mM). The basal concentration of cAMP in nanomolar is presented as mean ± SEM from a representative experiment out of six individual experiments performed in quadruplicate. ∗∗∗∗P < 0.0001, NS, not significant. Data were compared with EV with a two-tailed Student’s t-test. (B) Cells were transiently transfected with EV, FL, ΔNTF, or P622 plasmids along with pSRE-Luc plasmid. Basal induction of SRE was measured after an overnight serum starvation in a luminescence-based assay. Data are shown in RLUs and are presented as mean ± SEM from a representative experiment out of four individual experiments performed in quadruplicate. NS, not significant. Data were compared with EV with a two-tailed Student’s t-test. (C) Cells were transfected with EV, FL, ΔNTF, or P622 plasmids along with pCRE-Luc plasmid and after an overnight serum starvation, cells were stimulated with increasing concentrations of synthetic agonistic peptide P-15 for 5 h at 37 °C. Luciferase assay was performed as above. Data are shown in RLUs and are presented as mean ± SEM from a representative experiment out of four individual experiments performed in triplicate. Data were compared with EV with multiple t-test with Holm–Sidak test. ∗P < 0.05 (for FL), #P < 0.0001 (for ΔNTF), and ΨP < 0.0001 (for P622). (D) Cells were transfected as in A and after an overnight serum starvation without IBMX, cells were stimulated with increasing concentrations of agonistic peptide P-15 for 1 h at 37 °C in the presence of IBMX (0.5 mM). cAMP production was measured as above. The concentration of cAMP in nanomolar is presented as mean ± SEM from a representative experiment out of five individual experiments performed in quadruplicate. Data were compared with EV with multiple t-test with Holm–Sidak test. ∗P < 0.05 (for FL), #P < 0.001 (for ΔNTF), and ΨP < 0.001 (for P622). (E) Cells were transfected as in B and after an overnight serum starvation, cells were stimulated with increasing concentrations of P-15 for 5 h at 37 °C. Luciferase assay was performed as above. Data are shown in RLUs and are presented as mean ± SEM from a representative experiment out of four individual experiments performed in triplicate. Data were compared with EV with multiple t-test with Holm–Sidak test. #P < 0.001 (for ΔNTF) and ΨP < 0.001 (for P622). (F) Cells were transiently transfected with EV or GPR64-expressing plasmids along with pNFAT-Luc reporter plasmid. After an overnight serum starvation, basal and P-15–stimulated induction of NFAT was measured. Data were normalized to that of EV (treated with DMSO; RLU value: 112.8 ± 20.4) and are presented as mean ± SEM from three individual experiments performed in triplicate. Data were compared with EV with a two-tailed Student’s t-test. ∗P < 0.05, ∗∗∗P < 0.001, ∗∗∗∗P < 0.0001. (G, H) Parental HEK293 cells (WT), Gαq/11 KO cells (ΔGNAQ/11), or Gα12/Gα13 KO cells (ΔGNA12/13) were transiently transfected with either ΔNTF (G) or P622 (H) mutant in combination with pSRE-Luc reporter plasmid. After an overnight serum starvation, basal and P-15–stimulated induction of SRE was measured as in B. Data were normalized to that of WT cells treated with DMSO (RLU value: 785.3 ± 115.8) and are presented as mean ± SEM from a representative experiment from three individual experiments performed in triplicate. Data were compared with WT with two-tailed Student’s t-test. ∗∗∗P < 0.001, ∗∗∗∗P < 0.0001.

