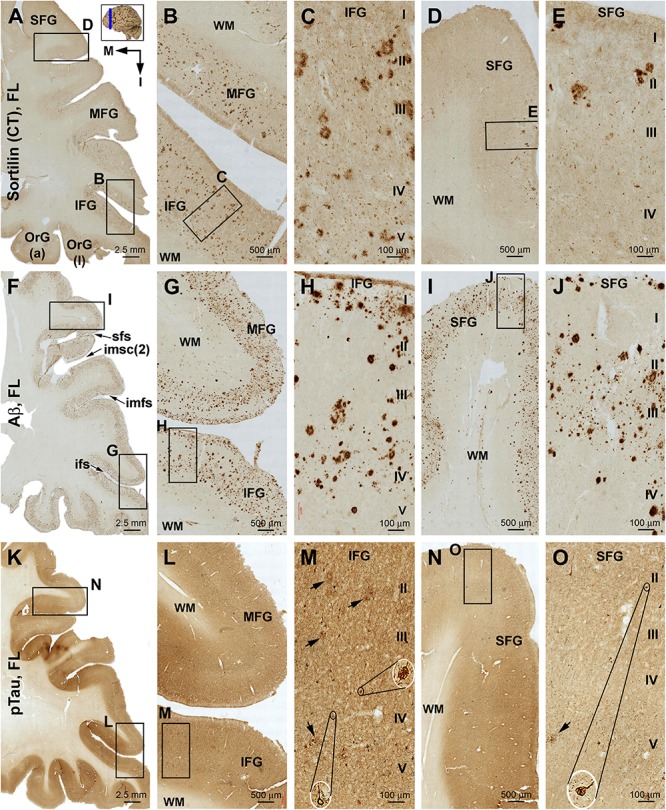
FIGURE 6.

Comparison of sorfra plaques, β-amyloidosis, and tauopathy in the frontal lobe regions in a brain with Thal phase 4 and Braak stage IV neuropathologies. Section orientation, figure panel arrangement, neuroanatomical structures, and scale bars are as indicated. (A–E) Low- and high-power views of the distribution and morphology of sorfra plaques as oriented. There is a high-to-low gradient in the amount or density of sorfra plaques as moving from the basal/inferior to lateral/superior frontal lobe gyri (A,B,D). At high magnification, sorfra plaques as well as sortilin-expressing neuronal profiles are present in the cortical gray matter (C,E). (F–J) Aβ immunolabeling in a neighboring section. The cortex is packed with β-amyloid plaques that appear to be comparable in numerical density over the basal and lateral frontal gyri. β-Amyloid deposition also occurs in some areas of the white matter as diffuse lesions, along the pia mater and layer I especially the low portion, and also at some vascular sites (G,H). (K–O) pTau immunolabeling in another neighboring section. Similar to the distribution pattern of sorfra plaques and different from that of Aβ deposition, pTau-positive neuronal somata and neurites are more densely distributed in the orbital gyri and the inferior frontal gyrus than in the middle and superior frontal gyri (L–O). At high magnification, most pTau-immunoreactive neurons appear tangled (M,O, examples are shown with enlarged insert). Phosphorylated tau-immunolabeled dystrophic neurites can also be densely packed as clusters (M,O, pointed by arrows). Abbreviations are as defined in Figure 3.
