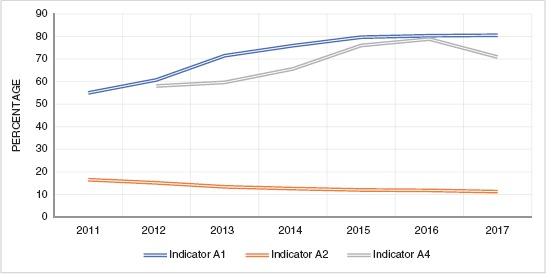
FIGURE 1. Time trend in LAC for indicators A1 “TB patients with documented HIV,” A2 “TB patients with positive HIV test,” and A4 “TB/HIV treatment,” 2011–2017.

Source: Prepared by the authors based on data extracted from WHO Tuberculosis database.
For indicators A1 and A2, the figure excluded Antigua and Barbuda, Cuba, Nicaragua, Saint Kitts and Nevis, and Saint Vincent and the Grenadines. Indicator A4 excluded Argentina, Brazil, Chile, Jamaica, Nicaragua, Saint Kitts and Nevis, and Saint Vincent and the Grenadines; information from 2011 was excluded since several countries lacked data.
