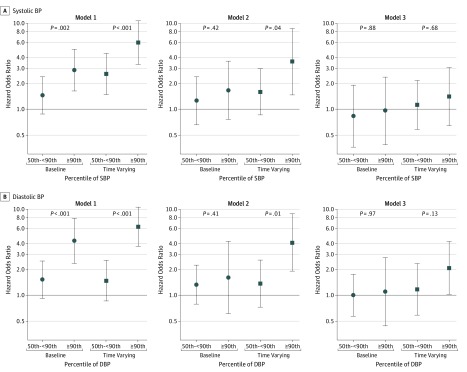
Figure 3. Hazard Odds Ratios for Development of the Composite Renal Outcome Among Participants With Glomerular Disease.
Circles represent hazard odds ratios from baseline blood pressure (BP) models; squares, hazard odds ratios from time-varying BP models. Model 1 is unadjusted; model 2, adjusted for age, sex, black race, antihypertensive use, estimated glomerular filtration rate, body mass index z score, and immunosuppressant use; and model 3, adjusted for all covariates in model 2 plus proteinuria. DBP indicates diastolic BP; SBP, systolic BP. Error bars indicate 95% CIs.

