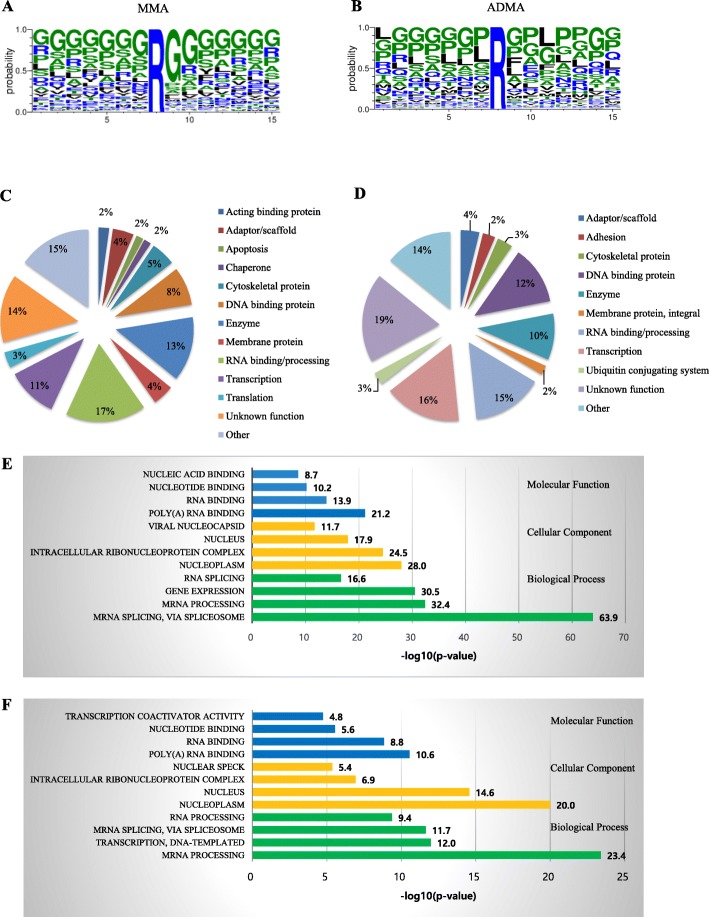
Fig. 2.
Motif and protein-type analyses of arginine methylation sites. Sequence logo for identified arginine methylation sites in CRC tissues (a) for MMA and (b) for ADMA. The 15-mer sequences were generated by Motif X. Sites that were within seven residues of protein termini were not used in the motif logo. The frequency map was generated with Weblogo. Of 455 MMA sites identified with an MMA motif kit, 54.1% had rG motif (a). Of 314 ADMA sites identified by an ADMA motif kit, 25.7% had the rG motif (b). Pie charts of protein classes for (c) MMA- and (d) ADMA-containing proteins identified in CRC tissues, respectively, based on annotations in PhosphoSitePlus® database [21]. Statistically enriched (e) monomethylated and (f) asymmetric dimethylated protein classes are categorized with Gene Ontology terms using DAVID. Significance is represented as –log (p value). Significance threshold is 1.301 = −log (p = 0.05). The length of each bar represents statistical significance. It is plotted as –log (p value). The number at the end of each bar shows this value

