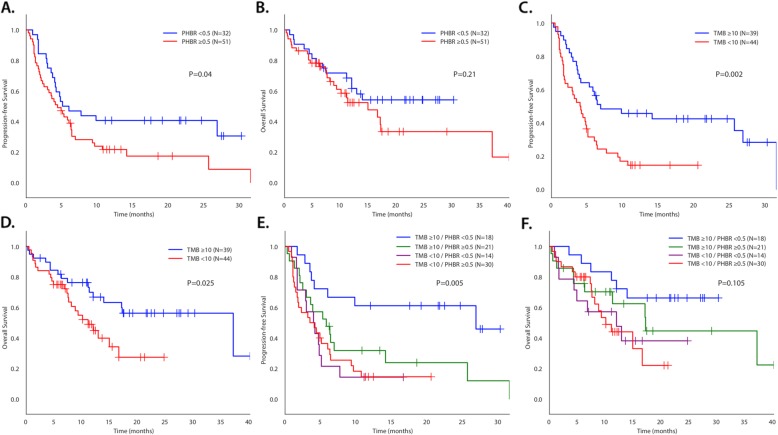
Fig. 1.
Kaplan-Meier PFS and OS for patients treated with immunotherapy. P values in Fig. 1 compare all four categories. They differ slightly from P values in Table 3, which compares value to the reference. PFS (a) and OS (b) dichotomized by PHBR < 0.5 and ≥ 0.5 (N = 83). PFS (c) and OS (d) dichotomized by TMB < 10 and ≥ 10 mutations/mb (N = 83). PFS (e) and OS (f) separated by TMB < 10 and ≥ 10 and PHBR < 0.5 and ≥ 0.5 (N = 83). For PFS (e), P = 0.005 for difference between all four curves. Curve for TMB ≥ 10/PHBR < 0.5 versus TMB ≥ 10/PHBR ≥ 0.5 was significantly different (P = 0.025); TMB ≥ 10/PHBR ≥ 0.5 did not differ significantly from TMB < 10/PHBR ≥ 0.5 (P = 0.19) or from TMB < 10/PHBR < 0.5 (P = 0.26); TMB < 10/PHBR ≥ 0.5 did not differ significantly from TMB < 10/PHBR < 0.5 (P = 0.91). For OS (f), P = 0.1 for difference between all four curves. Differences between individual curves were not statistically different

