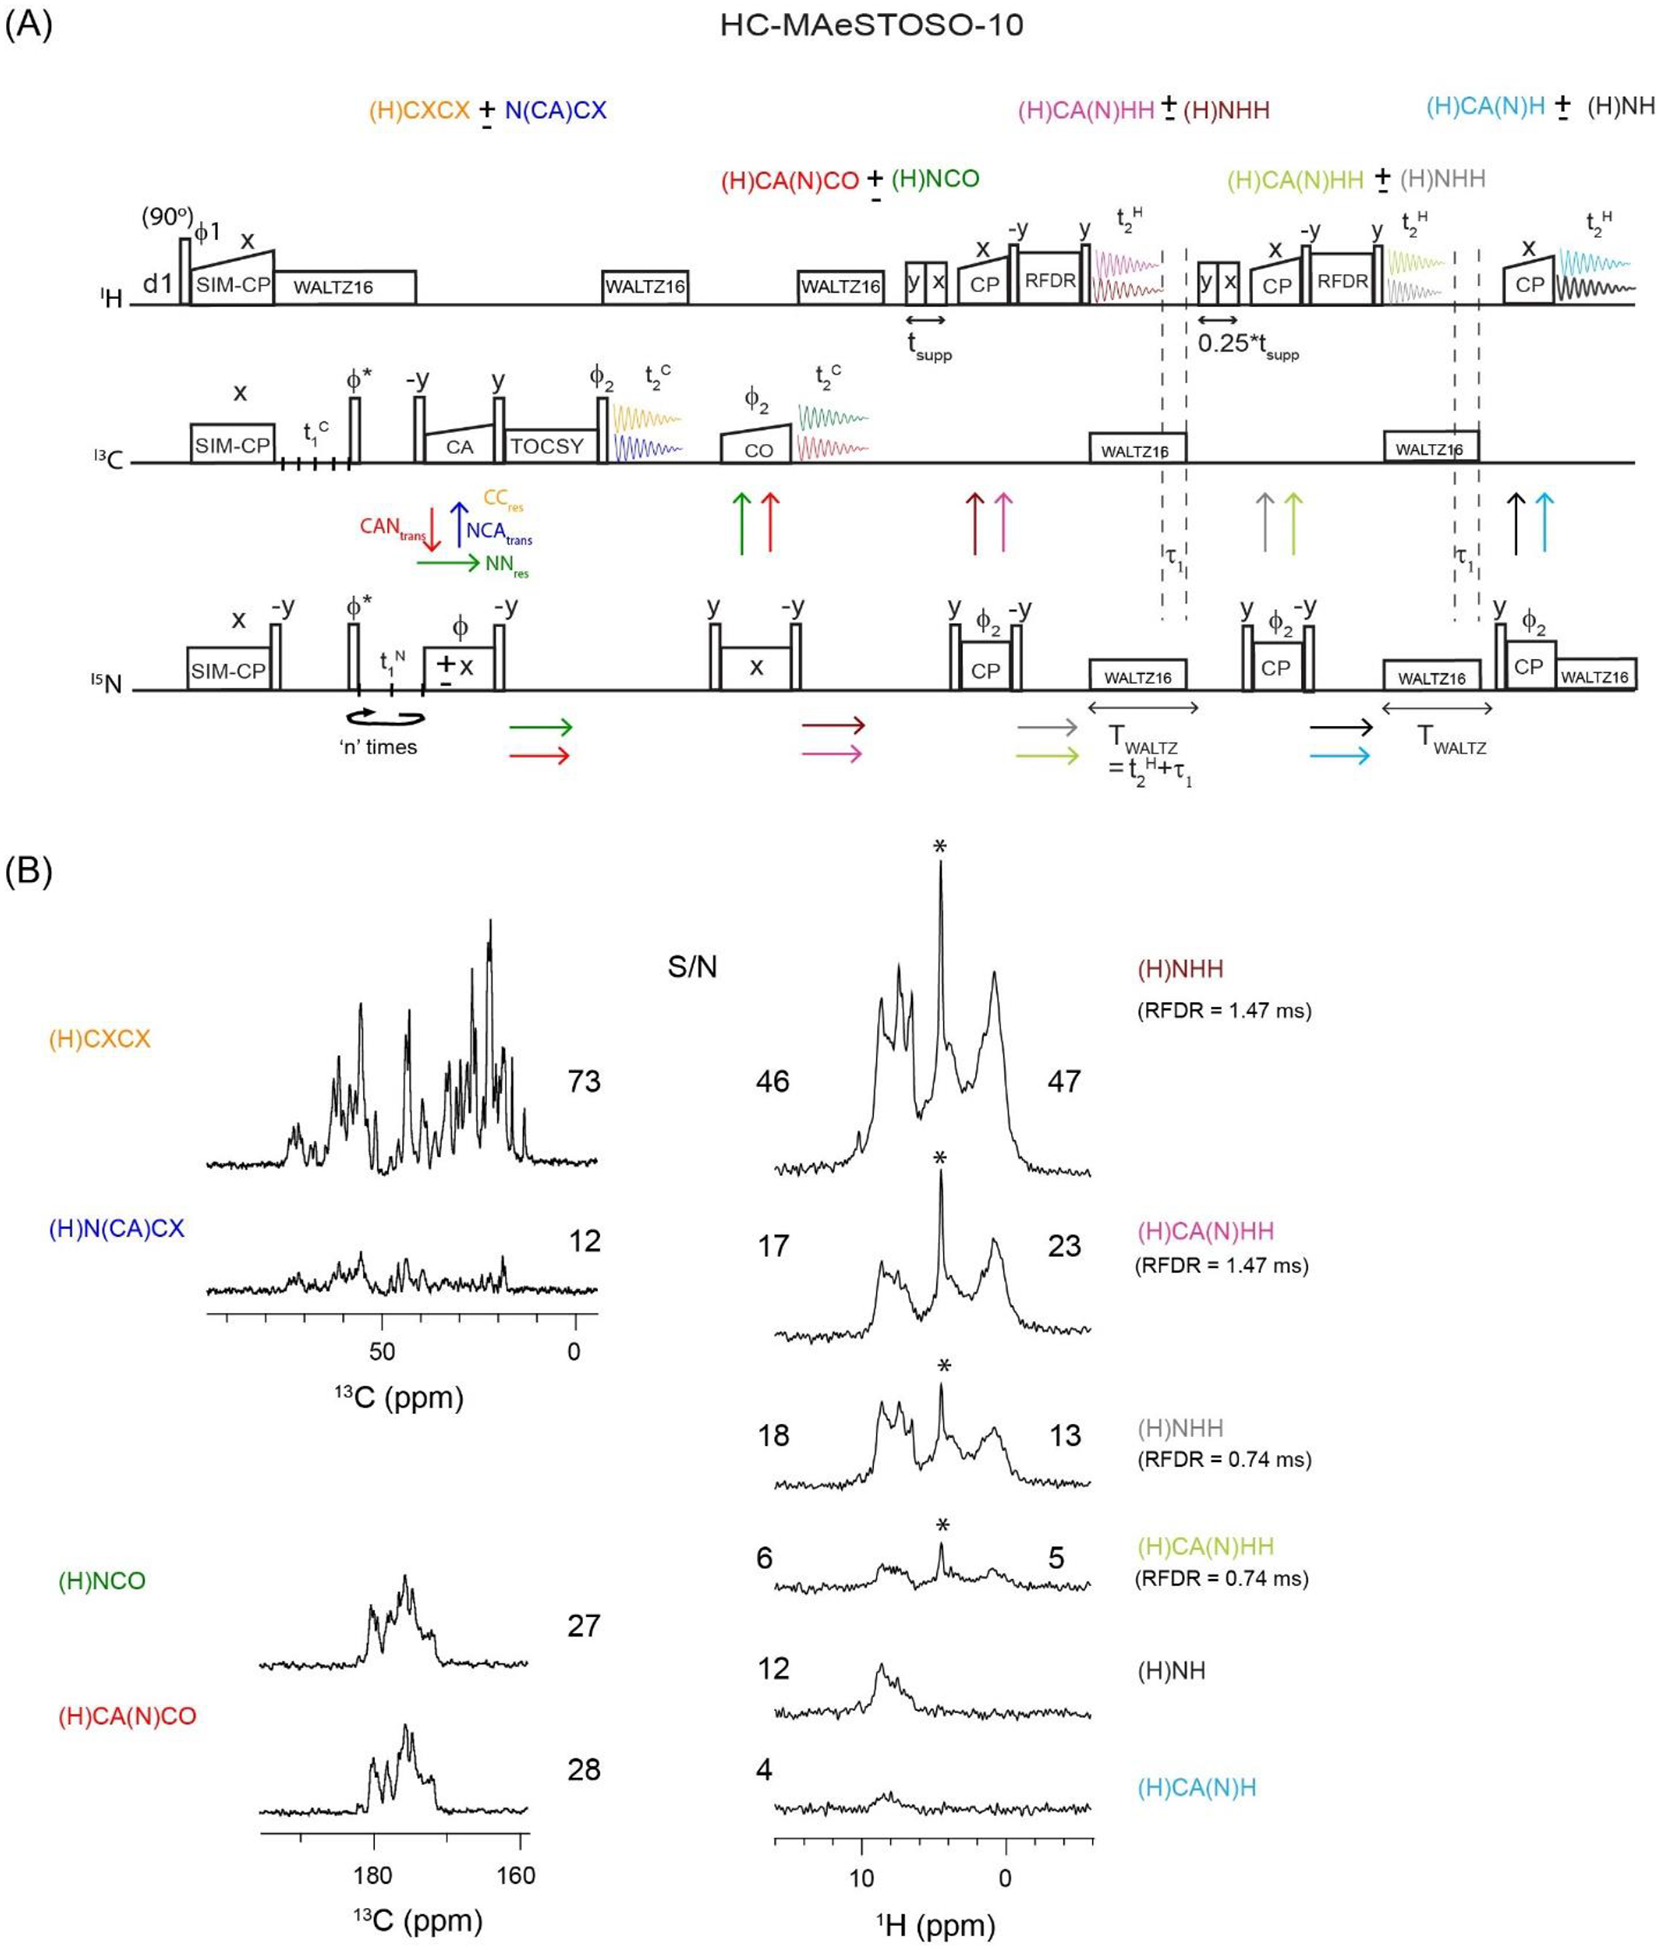
Figure 5:

(A) Dual receiver HC-MAeSTOSO-10 pulse sequence for the simultaneous acquisition of four 13C detected, and six 1H detected experiments. The phase cycle is set to, ϕ1=y, −y; ϕ2=x, x, −x, −x; ϕrec=y, −y, −y, y. (B) HC-MAeSTOSO-10 1D spectra of GB1 protein obtained from the first increment (t1C, t1N=0). The integrated S/N values for each 1D spectra are shown in Figure 5B. For 1H spectra with HH RFDR mixing, the S/N values are calculated for HN (6 to 10 ppm) and HC (0 to 4 ppm) spectral regions, and respectively shown on the left and right sides of the 1D spectra. The 1H peak at 4.7 ppm, indicated by *, corresponds to water signal.
