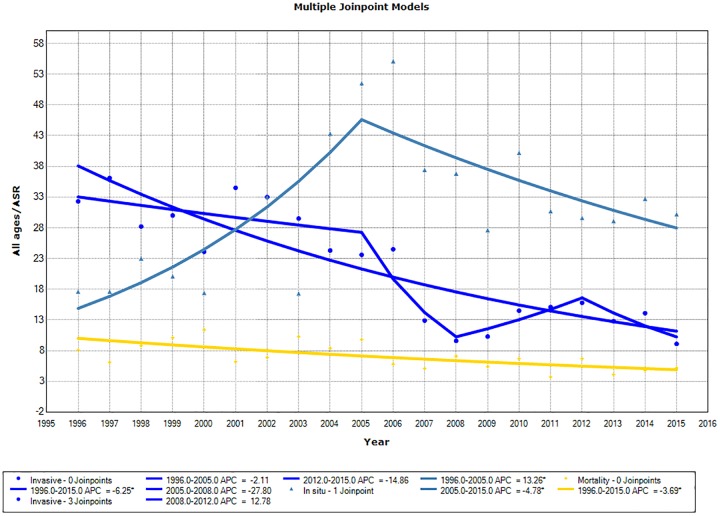
Fig 2. Trends in age-standardized incidence and mortality rates for cervical cancer.
The age-standardized rate curves are shown (ASR) for all ages, with 3 joinpoints, demonstrating Annual Percent Change (APC) with no joinpoint, expressing Average Annual Percent Change (AAPC) (dark blue); carcinoma in situ incidence curve (lighter blue); and mortality curve (yellow).

