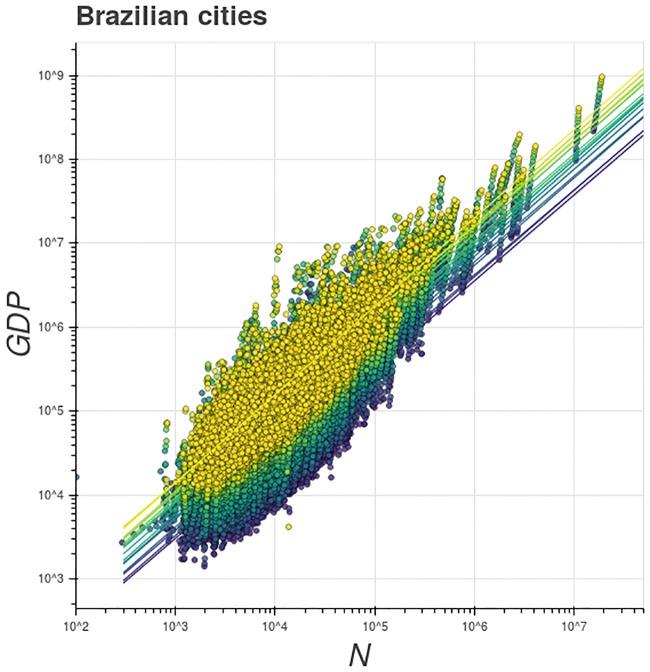
Fig 1. Transversal scaling of GDP.
Scaling relation between population and GDP of Brazilian cities, from 1998 (blue) to 2014 (yellow). The straight lines are the best power-law equation fits for each year (by the maximum likelihood method). The straight lines are virtually parallel, which shows that the transversal scaling exponent is constant and robust. The scaling exponent is always greater than 1 for all years, with a mean . It reveals a superlinear scaling property, compatible with the fact that the GDP is a socio-economic urban variable. The numeric time evolution of the transversal scaling exponent and the intercept parameter are shown in Fig 2.

