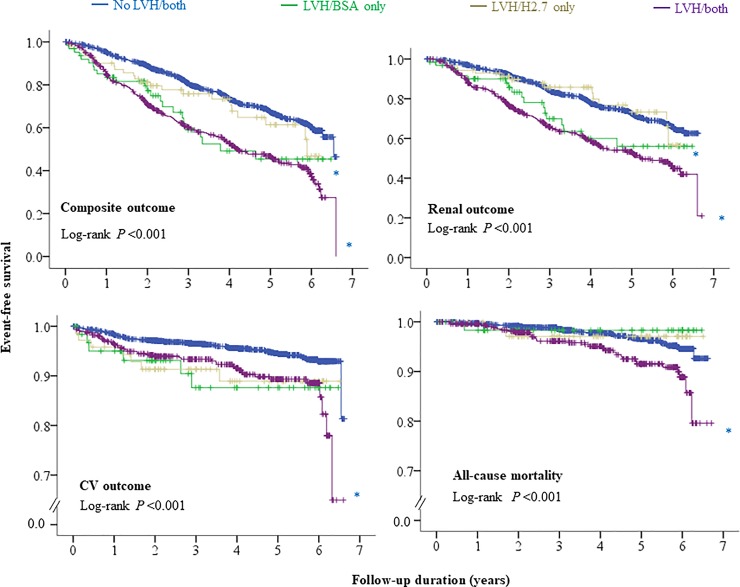
Fig 2. Kaplan Meier survival curve of left ventricular hypertrophy (LVH) groups defined by left ventricular mass index by body surface area (BSA) or height to the 2.7 power (H2.7) for adverse clinical outcomes.
*, †, and ‡ meant P < 0.01 when compared to No LVH/both, LVH/BSA only, and LVH/H2.7 only groups, respectively, by using log-rank test.

