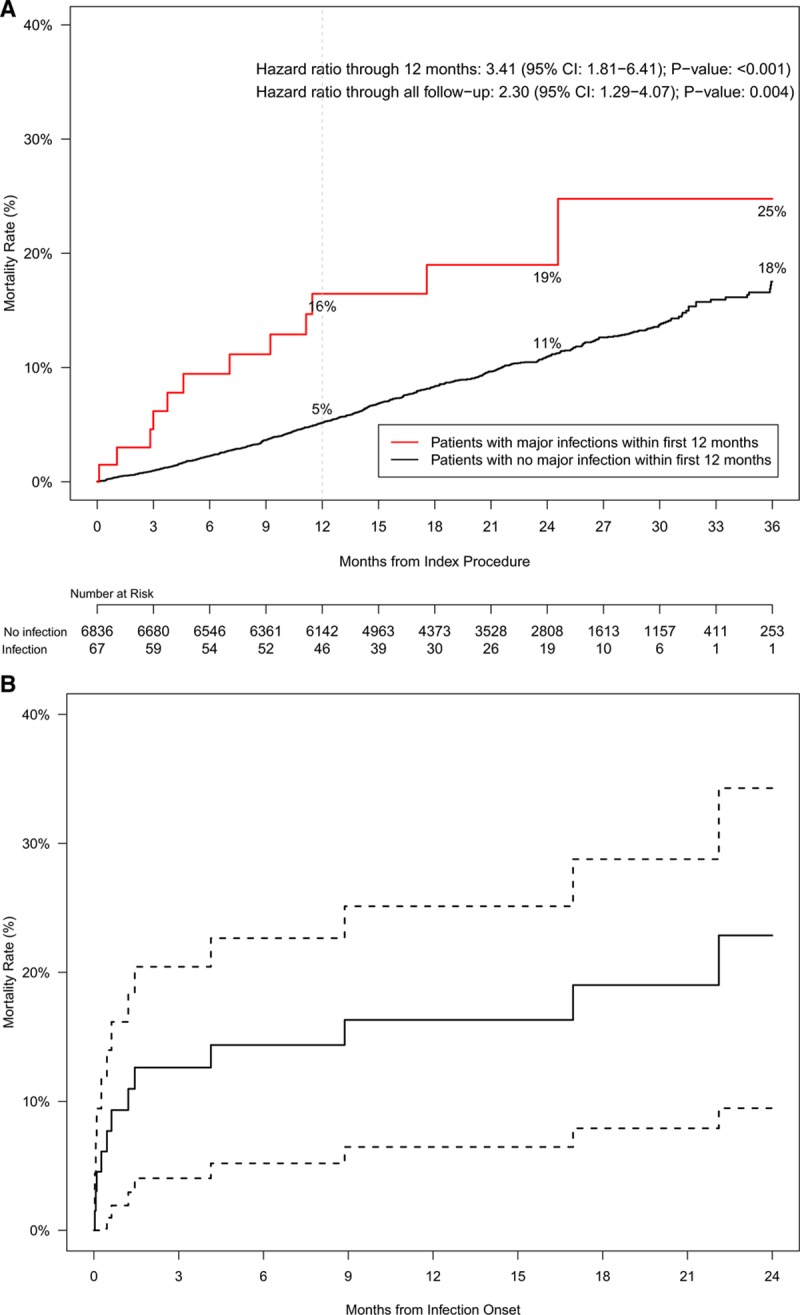
Figure 1.

Kaplan-Meier all-cause mortality curves.
A, Patients with (cohort with major infections) and without infections (cohort with no major infections). Hazard ratios and P values are calculated using Cox proportional regression modeling. As compared with the no infection group, infections were associated with an increased risk of death. The effect on mortality was sustained beyond 12 mo. B, Kaplan-Meier (KM) curve and 95% CI for patients with major infection from infection onset. Of the patients in the cohort with major infections, the KM estimates of mortality after major infection onset were 16% at 12 mo and 23% at 24 mo.
