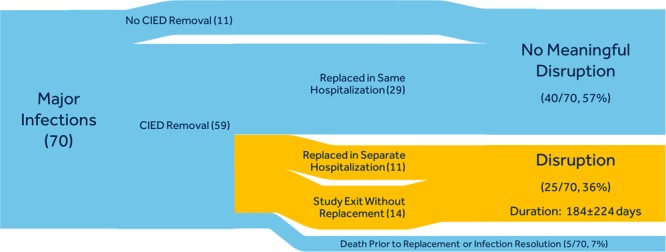
Figure 3.

Cardiac implantable electronic device (CIED) therapy disruption.
Time spent without previously indicated CIED therapy. Widths of the paths are proportional to the number of patients in the Sankey Diagram indicating treatment pathway for infections with (blue) and without (orange) CIED therapy disruption. Approximately 36% of infections involved disruption of CIED therapy.
