
Fig. 4 –
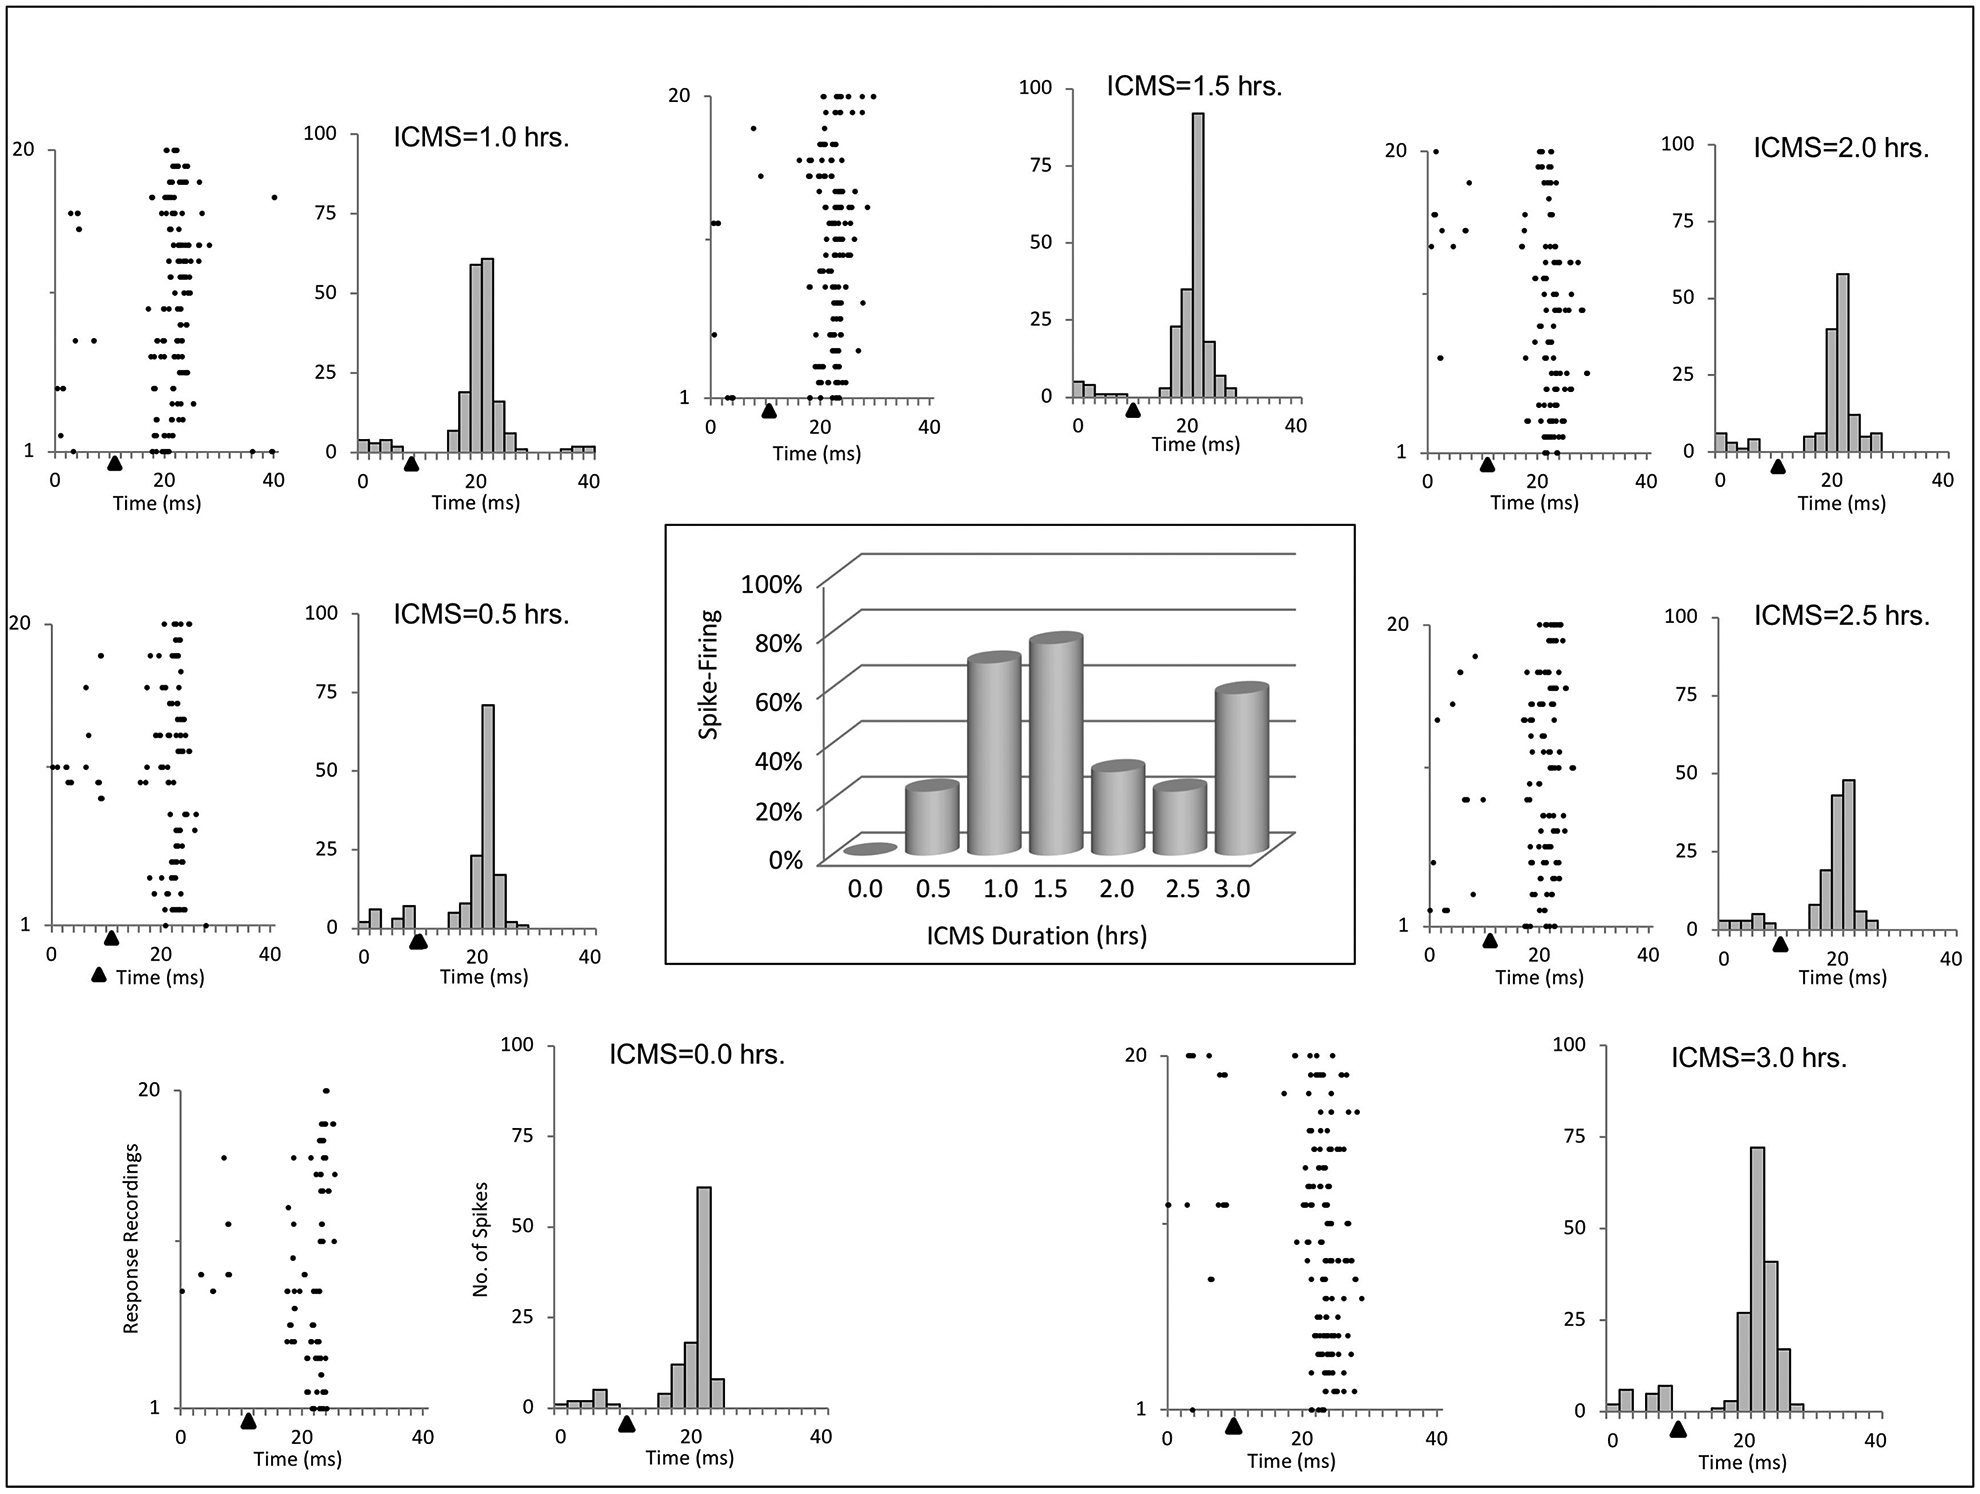
Raster plots and histograms of evoked responses recorded from homotopic sites in the forepaw representation over a 3-hr time course of ICMSr are shown for 1 rat. However in this example, the greater percent evoked response increases were observed at 1.0 and 1.5 hr after ICMSr and did not return to these levels during the remaining period of stimulation. This is shown in the bar graph (center) for the 3 hr duration time. Solid triangles mark the time of stimulus onset.