
Fig. 7 –
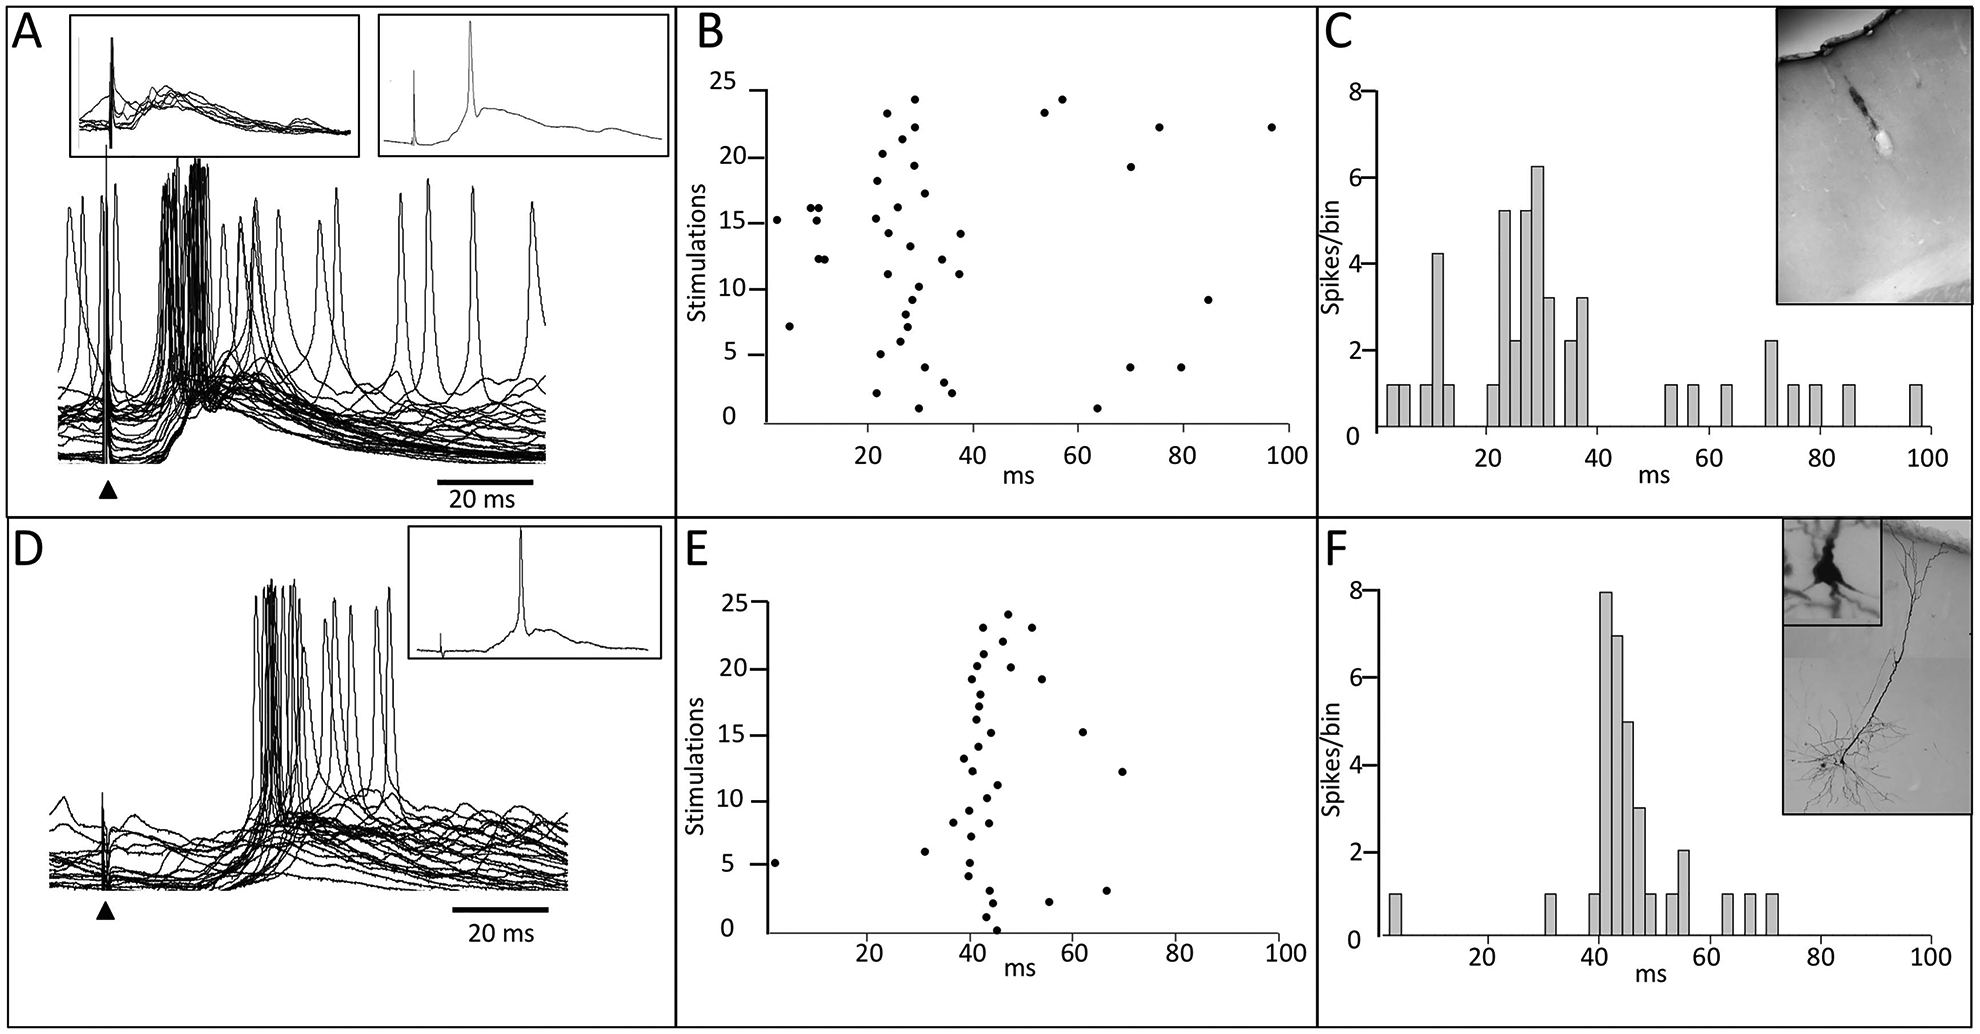
Ipsilateral input in facilitated SI following ICMSr – intracellular record. (A) Initial stimulation in the forepaw representation in layer V of SI evoked a post-synaptic response in a homotopic site in the opposite SI forepaw cortex; left inset in (A) shows a series of 10 consecutive stimulations, and the inset at right, shows a single response. After approximately 30 min of ICMSr, the subthreshold response became elevated to a suprathreshold firing level, and this is shown in the bottom trace in (A). Raster plot and histogram are shown in (B) and (C), respectively. Inset in (C) shows the location of the stimulation site in SI. At 3-hr of ICMSr, stimulation of the ipsilateral forepaw (digit 3) evoked a response and the raw data are shown in (D); single trace are shown in the inset in (D). Raster plot and histogram are shown in (E), and (F), respectively. The inset in (F) shows the labeled cell in layer V that was injected with biocytin. Solid triangles mark the time of stimulus onset.