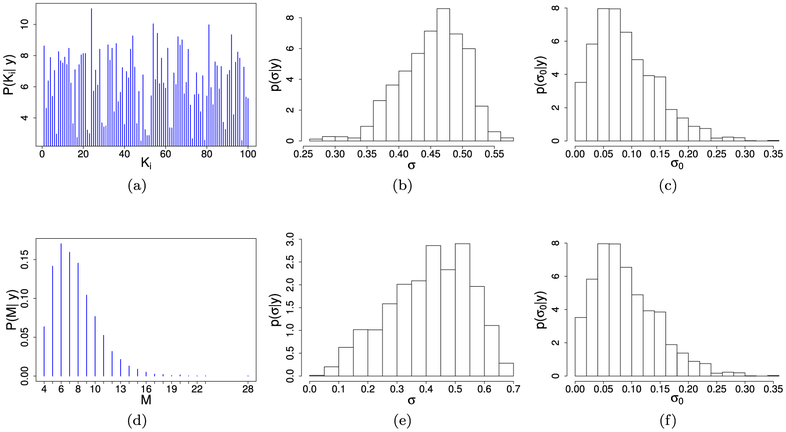
Figure 4:
Simulation study, contaminated data: t-NGG vs t-HNGG models. (a) Posterior mean of the number of clusters in each data vector (t-NGG); (b,c) posterior distribution of σ and σ0 (t-NGG); (d) posterior distribution of the number of clusters M (t-HNGG); (e,f) posterior distribution of σ and σ0 (t-HNGG).

