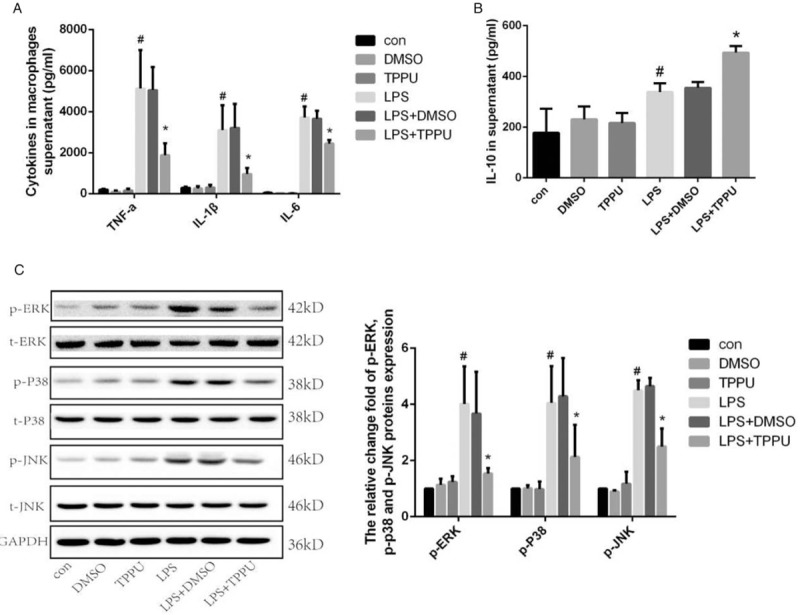
Fig. 4.
TPPU treatment induced changes of cytokines release and MAPK signaling pathway in LPS-stimulated macrophages.

A, The concentrations of TNF-α, IL-1β, IL-6 in supernatants of macrophages. B, Concentration of IL-10 in supernatants of macrophages. C, Protein expression and phosphorylation of ERK1/2, p38MAPK (p38), and JNK in macrophages. Data are expressed as means ± SEM, #P < 0.05 versus Con group, ∗P < 0.05 versus LPS group. LPS, lipopolysaccharide; MAPK, mitogen-activated protein kinase.
