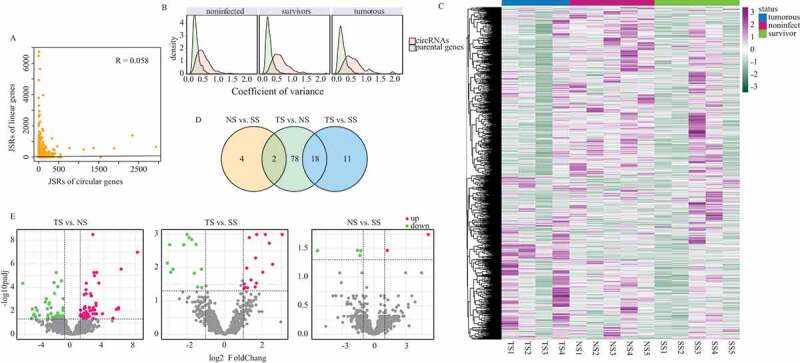
Figure 2.

Expressional profile of circRNAs. (a) Expression correlation between circRNAs and their respective parental genes. Reads that spanned junction site reads (JSRs) were compared between circular and linear RNAs. (b) Expression variance of circRNAs and their parental genes in three groups. (c) Heatmap showing the expression of all circRNAs identified in this research. Read counts of each circRNAs were scaled into Z score. (d) Number of differentially expressed circRNAs in three different contrasts. (e) Volcano plots depicting differentially expressed circRNAs in three contrasts. The horizontal dashed lines represent the adjusted p value cut-off of 0.01 and the perpendicular dashed lines represent |LFC| cut-off of 1.
