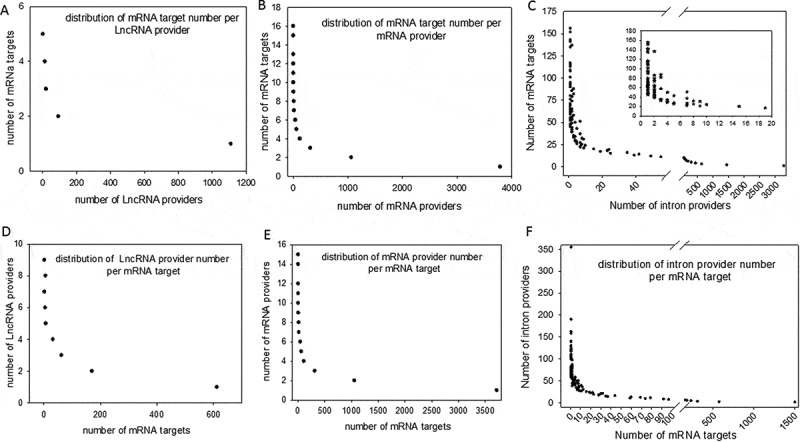
Figure 3.

Distribution of computationally identified dsRNAs The duplex RNAs were analysed as the number of targets (mRNAs) by provider and as the number of providers (lncRNA, mRNA and introns) by target (mRNA). For each of our computationally generated lists, we counted the number of individual target mRNAs that matched 1 to x different providers; the figure shows the series from 1 to x for lncRNAs (A), mRNAs (B) and introns (C). Conversely, we counted how many unique providers of lncRNAs (D), mRNAs (E) and introns (F) matched a series of 1 to x different mRNA targets. A higher magnification of the distribution of the lowest values is presented in a box for the intron/mRNA graph.
