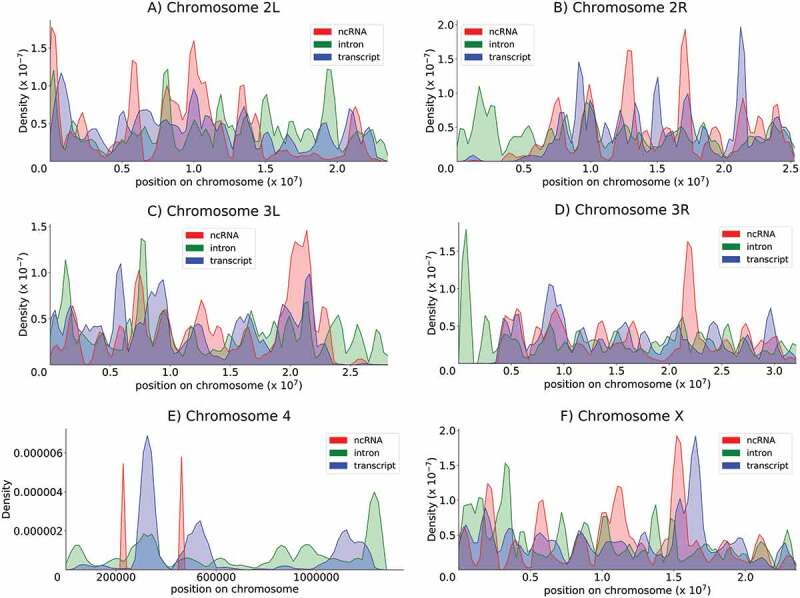
Figure 5.

Chromosomal distribution of provider genes The density of RNA providers (lncRNAs, introns and mRNAs) within the genome was estimated through kernel density estimation (KDE). Chromosomes 2L, 2R, 3L, 3R, 4 and X are represented. Red, green and blue indicate lncRNAs, introns and mRNAs, respectively.
