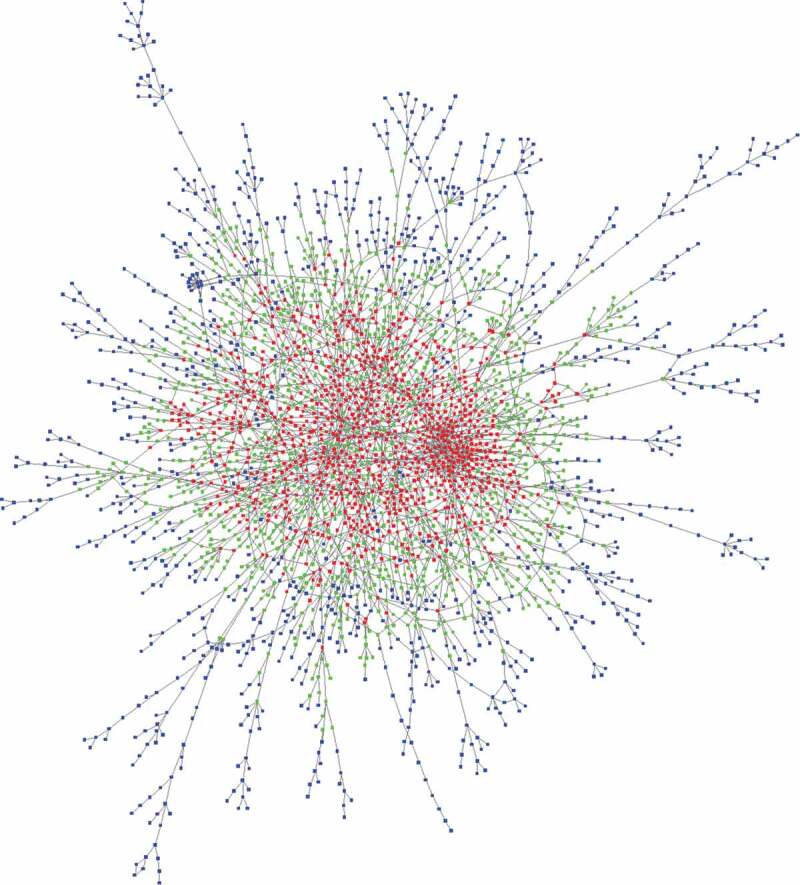
Figure 7.

Interactions among the genes in our computationally generated lists Genes retrieved from RNA datasets were considered as both targets and providers, and their interactions were represented as a network. Each of the 2997 vertices of the graph represents a gene, and each edge represents an interaction. Genes are divided into 3 categories of equal size depending on their centrality in the graph. Red vertices represent central genes, blue vertices represent genes located at the periphery of the graph, and green vertices identify the remaining genes.
