FIGURE 1.

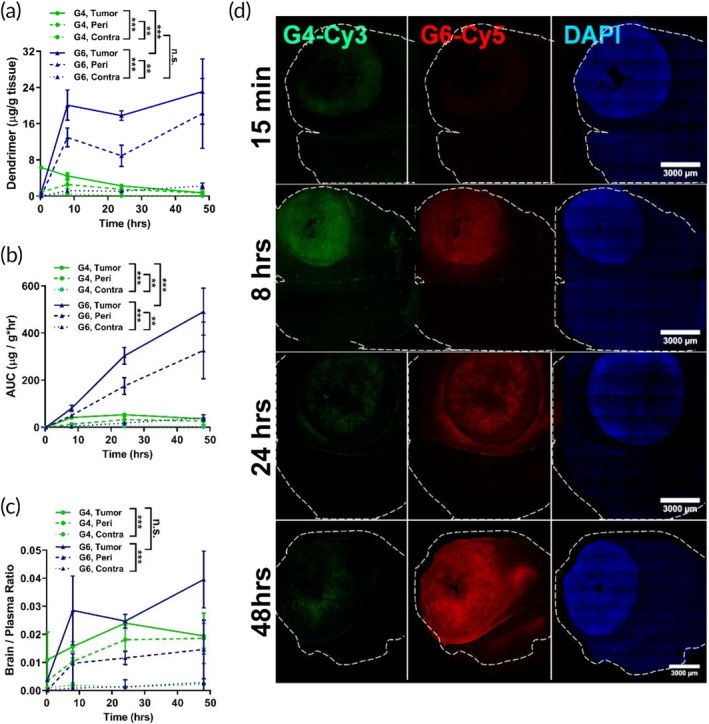
Comparison of G4 and G6 kinetics in gliosarcoma. Fluorescently labeled G4 and G6 dendrimers were injected intravenously into 9L gliosarcoma brain tumor‐bearing mice. (a) G6 dendrimers (blue, solid triangle) exhibit increased accumulation (15 min, 8, 24, 48 hr) in the tumor (solid line) and peritumor areas (dash line) compared to G4 dendrimers (green, solid circle) while maintaining low levels in the contralateral hemisphere (dotted line). (b) Area under the curve (AUC) calculations for G4 and G6 dendrimers based on Figure 1a. (c) G6 dendrimers improve tumor/plasma ratio compared to G4 dendrimers. (d) Confocal imaging of G4 (green) and G6 (red) dendrimer distribution in the tumor‐bearing brain. The tumor mass is indicated by nuclear DAPI staining (blue). Scale bar = 3 mm. *** p < .001, ** p < .01, ns p > .1
