Figure 3.

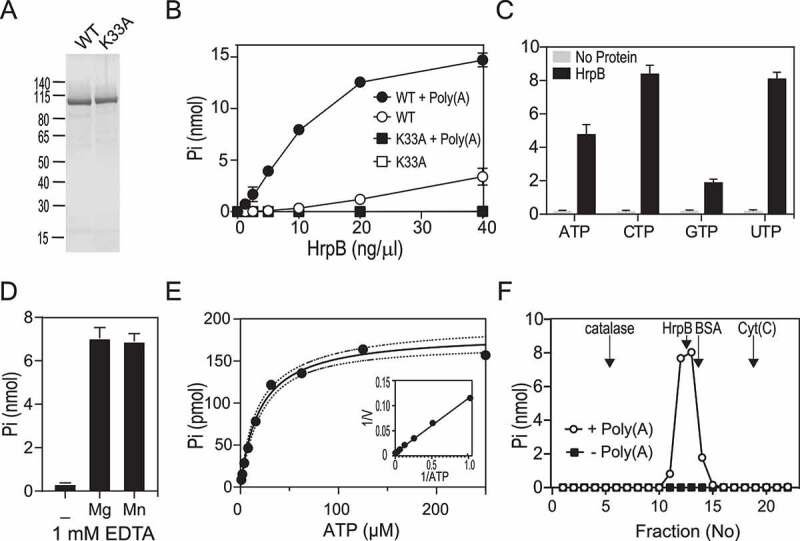
ATPase activity of recombinant HrpB. (A) HrpB purification. Aliquots (2.5 µg) of the nickel-agarose preparations of wild-type (WT) HrpB (lane 1), and mutant K33A (lane 2) were analysed by SDS-PAGE. The polypeptides were visualized by staining with Coomassie Blue dye. The positions and sizes (kDa) of marker polypeptides are indicated on the left. (B) ATPase. Reaction mixtures (15 µl) containing 50 mM Tris-HCl (pH 8.0), 1 mM DTT, 2 mM MgCl2, 1 mM [γ-32P] ATP, 250 ng/µl Poly(A) (or no RNA), and wild-type (WT) or K33A mutant as specified were incubated for 15 min at 37°C. Pi release was determined as described in Materials and Methods and was plotted as a function of input protein. (C) Nucleotide specificity. Reaction mixtures (15 µl) containing 50 mM Tris-HCl (pH 8.0), 1 mM DTT, 2 mM MgCl2, 250 ng/µl Poly(A), 5 ng/µl WT HrpB (or no added enzyme) and 1 mM nucleotide triphosphate as specified were incubated for 15 min at 37°C. The reactions were quenched by adding 1 ml of malachite green reagent. Phosphate release was determined by measuring A620 and extrapolating the value to a phosphate standard curve. (D) Metal dependence. Reaction mixtures (15 µl) containing 50 mM Tris-HCl (pH 8.0), 1 mM EDTA, 1 mM DTT, 1 mM [γ-32P] ATP, 250 ng/µl Poly(A), 5 ng/µl WT HrpB, and either No divalent cation (-) or 2 mM of the divalent chloride salt were incubated for 15 min at 37°C. The extends of ATP hydrolysis are plotted. (E) Kinetics parameter. Reaction mixtures (15 µl) containing 50 mM Tris-HCl (pH 8.0), 1 mM DTT, 250 ng/µl Poly(A), 5 ng/µl WT HrpB, and [γ-32P] ATP as specified were incubated for 15 min at 37°C. The extent of Pi release is plotted as a function of ATP concentration. The inset shows a double-reciprocal plot of the rate of Pi formation. (F) ATPase activity profile of the glycerol gradient sedimentation of HrpB. Reaction mixtures (15 µl) containing 50 mM Tris-HCl (pH 8.0), 1 mM DTT, 2 mM MgCl2, 1 mM [γ-32P] ATP, 250 ng/µl Poly(A) (or no RNA), and 2 µl of the indicated glycerol gradient fractions (Supplementary Figure S6) were incubated for 15 min at 37°C. The peaks of marker proteins are indicated by vertical arrows (Supplementary Figure S6). (B-D) Data are the average ± SEMs from three independent experiments.
