
Figure 7.
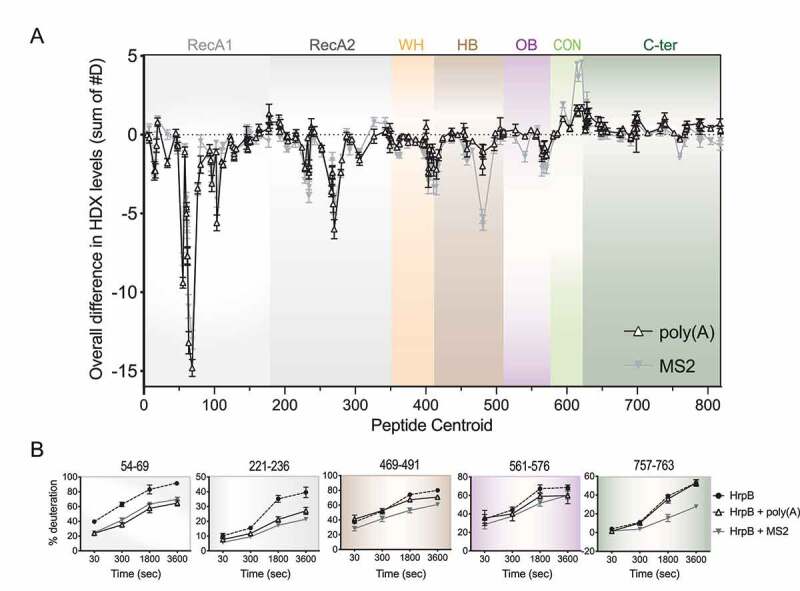
Identification of HrpB RNA responsive regions by HDX-MS. (A) Linear plot highlighting HDX changes in HrpB induced by poly(A) (white triangles) or MS2 (grey triangles) as a function of the central residue number for each peptide (x-axis). Coloured regions correspond to the RecA-like, WH, HB, OB, CON, and C-ter domains as in Fig. 1. (B) Deuterium uptake plots (% deuteration ± standard deviation) over time of some HrpB regions. Residue number is indicated on top of each graph. Graph background is coloured according to the domain to which they belong, according to panel A and Fig. 1.