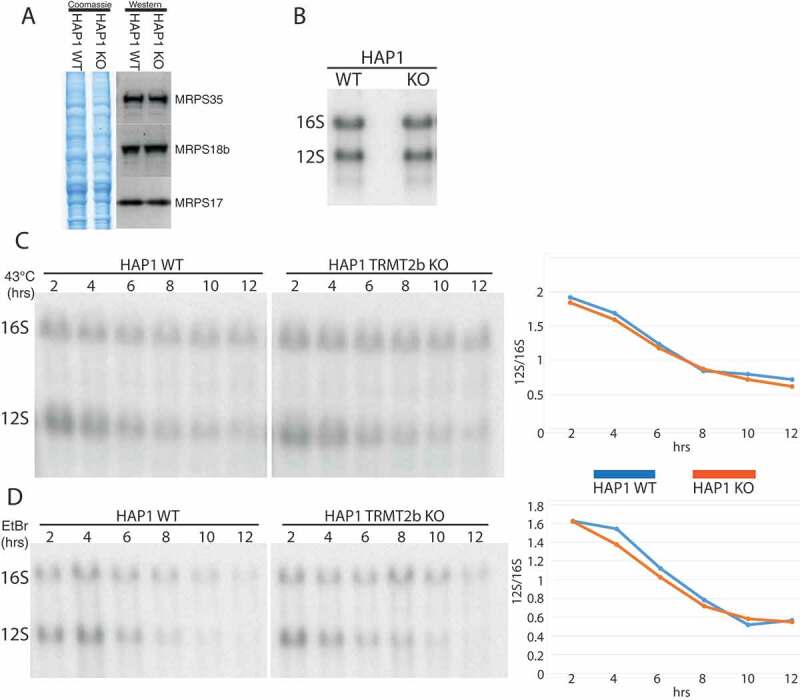
Figure 6.

Mitoribosome integrity following the loss of TRMT2B.
(A) Western blot using lysates derived from HAP1 WT and KO probed using antibodies against three protein components on the small subunit. Coomassie gel staining shown as loading control. (B) Northern blot analysis of total RNA extracted from HAP1 parental cell line (WT), or a HAP1 TRMT2B knockout cell line (KO). (C) Northern blot analysis of total RNA extracted from HAP1 WT and TRMT2B KO cell lines following their growth at 43°C for between 2 and 12 hours. Quantification values plotted as the ratio between 12S and 16S. (D) Northern blot analysis of total RNA extracted from HAP1 WT and TRMT2B KO cell lines following their exposure to 250 μg/mL ethidium bromide (EtBr) for between 2 and 12 hours.
