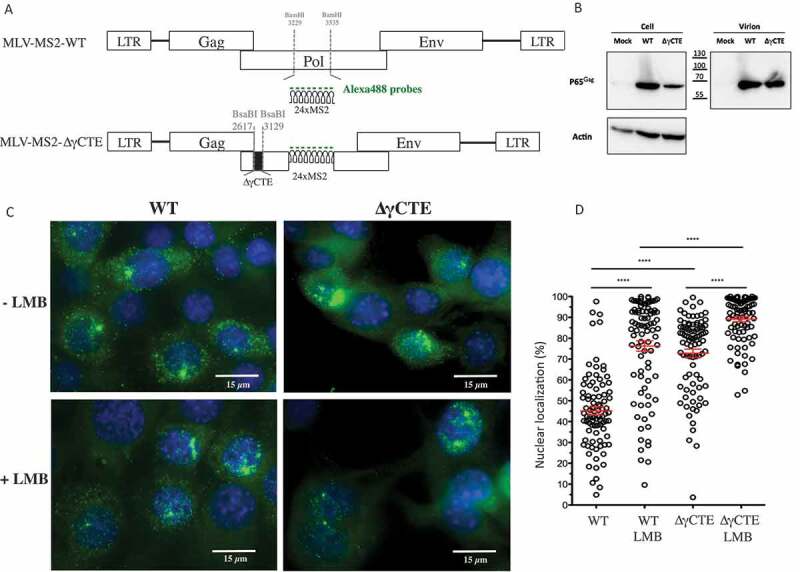
Figure 1.

Intracellular localization of FL RNA after NXF1 and/or CRM1 inhibition. (A) Schematic representation of the plasmids used in the experiments. MS2 stem loops insertion and γCTE deletion are shown. The fluorescent probes used to specifically detect the FL RNA are marked in green. (B) Western blotting of protein extracted from NIH3T3 cells transfected with the different constructs and from purified virions. The expressions of Gag (65 kDa) and Actin (42 kDa) are shown. (C) Representative images of MS2-tagged RNA (green) detected by sm-FISH in cells expressing WT or ∆γCTE MLV, treated or not with LMB. The nuclei are stained with DAPI (blue). For each cell, at least 11 stacks were taken and the image resulted from the sum of all stacks for each condition (D) Values of nuclear FL RNA levels are presented as the mean ± SEM of 86 cells from at least three independent transfections. The significance of differences between conditions was assessed using an unpaired Student’s t-test (****P ≤ 0.0001).
