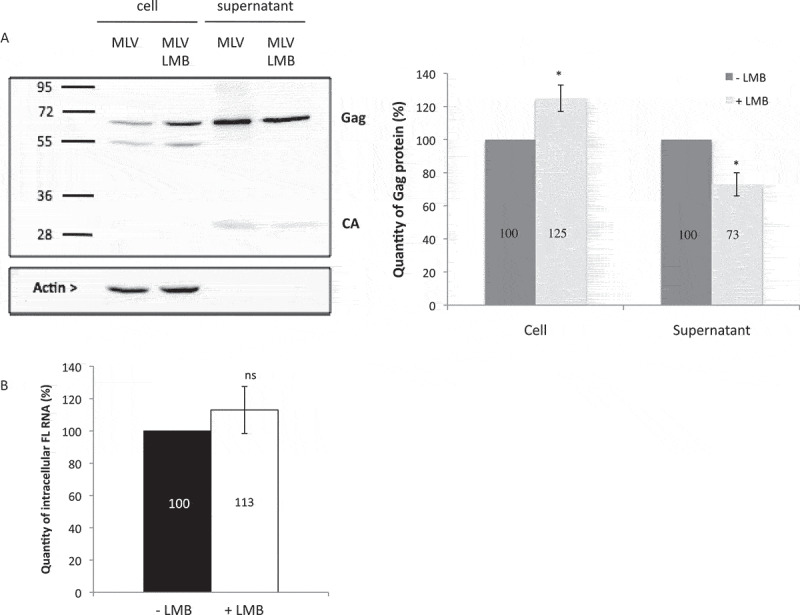
Figure 2.

Impact of CRM1 on MLV translation. (A) Gag protein analysis. NIH3T3 cells chronically infected with MLV were treated or not with LMB. The expressions of Gag (65 kDa), Capsid (30 kDa) and Actin (42 kDa) are shown. The blot is a representative experiment among three independent assays. Band integrated densities were determined with the ImageJ software and normalized to Actin. Intensities are presented in the histogram as mean +/− SEM and the significance of differences with control (MLV-LMB) was assessed using an unpaired student’s t-test (*P ≤ 0.05). (B) Effect of LMB on MLV transcription in cells. Intracellular FL RNA levels were specifically determined by RT-qPCR and normalized to the copy numbers of GAPDH mRNA. Percentages are given in graph and are not significantly distinct between ± LMB as assessed by unpaired student’s t-test (nsP > 0.05).
